New version: Resource Usage
Ingantt is becoming an even more useful scheduling tool with a new feature that is being rolled out across all of the supported platforms.
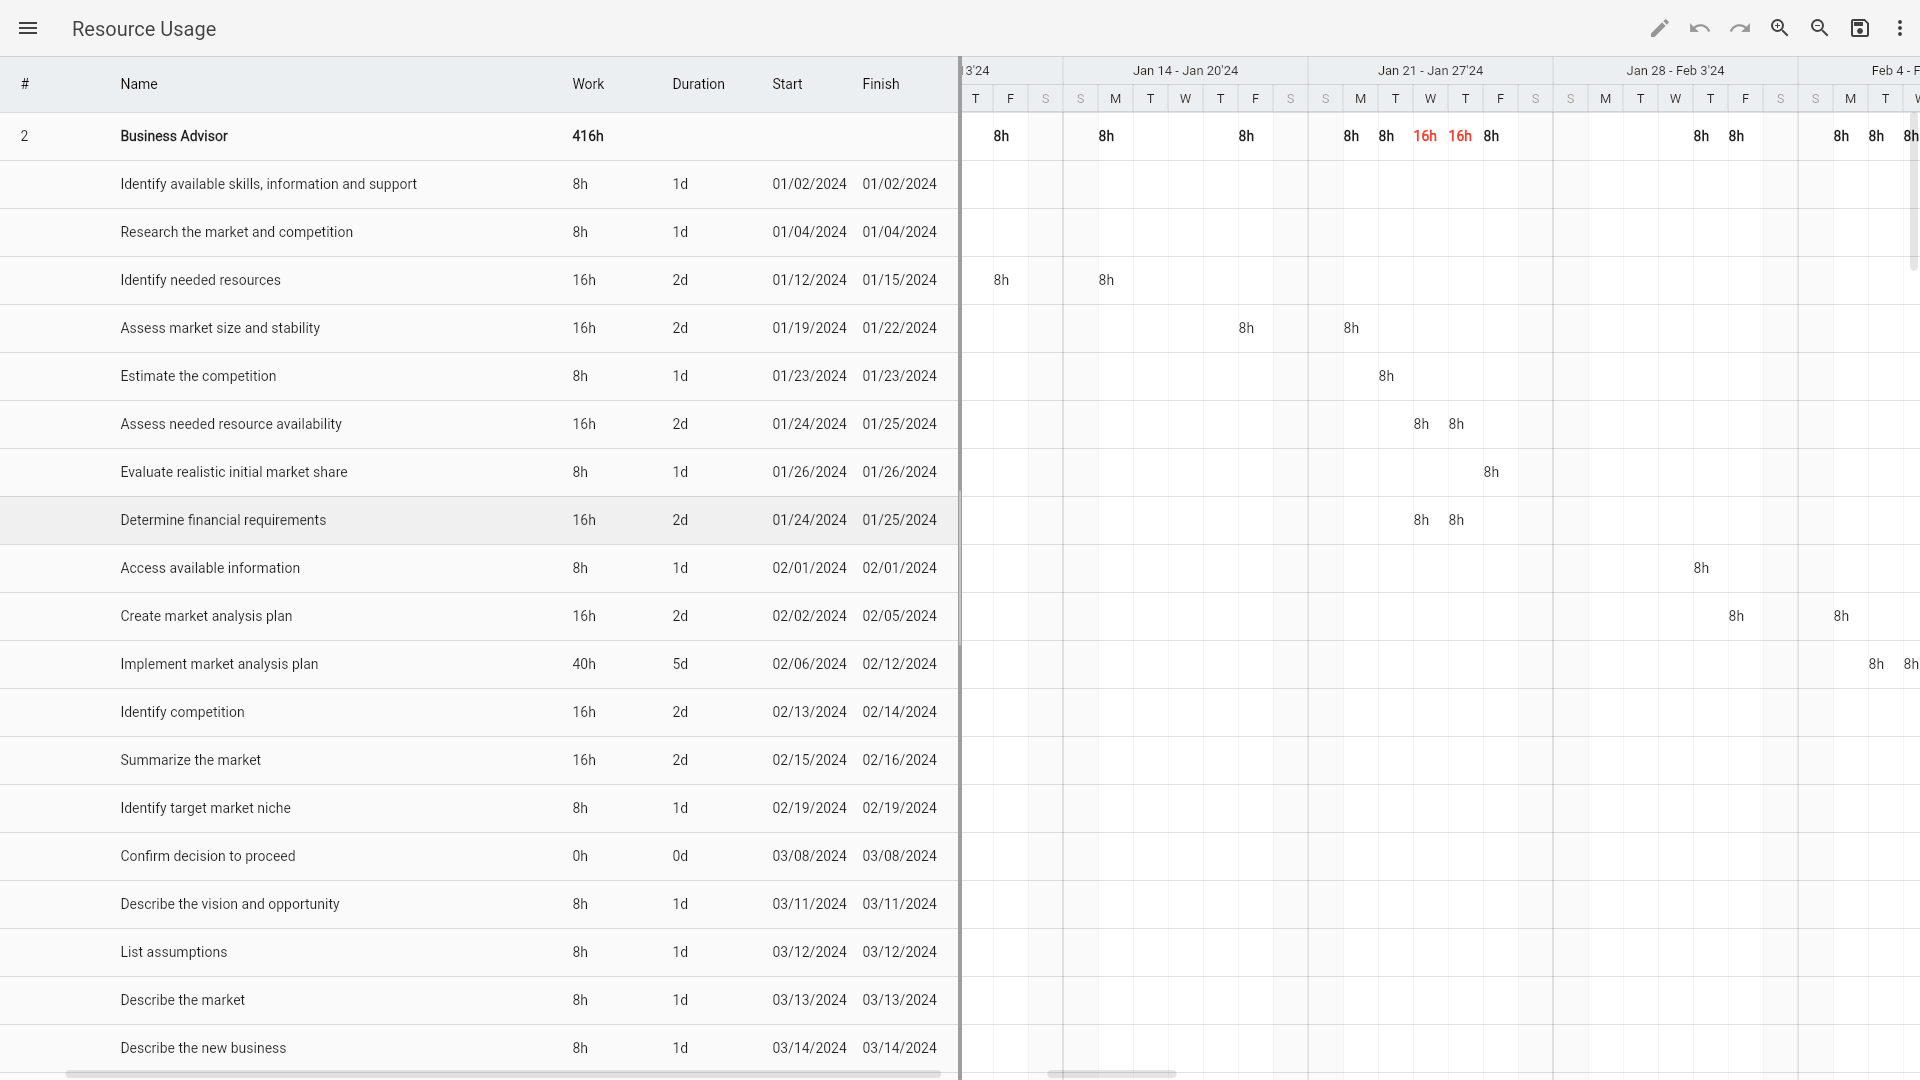
Right from the start Ingantt has the ability to detect and automatically fix overallocated resources. And now you have the ability to see exactly on which periods your resources are overallocated, how they spend their time on each task and what's the total work that they do. All thanks to the new view in Ingantt called Resource Usage view.
At first, you might find that this view looks similar to the standard split view with the Gantt chart. However, there are quite a few differences. On the left, tasks are shown grouped by their assigned resources. On the right, in the chart, you see the work that each resource does on each task as well as the total work the resource. If a resource is overallocated within a particular period, its corresponding work data is highlighted in red.
Use the new feature to plan the work of your resources better. Meanwhile, more features are on the way!