
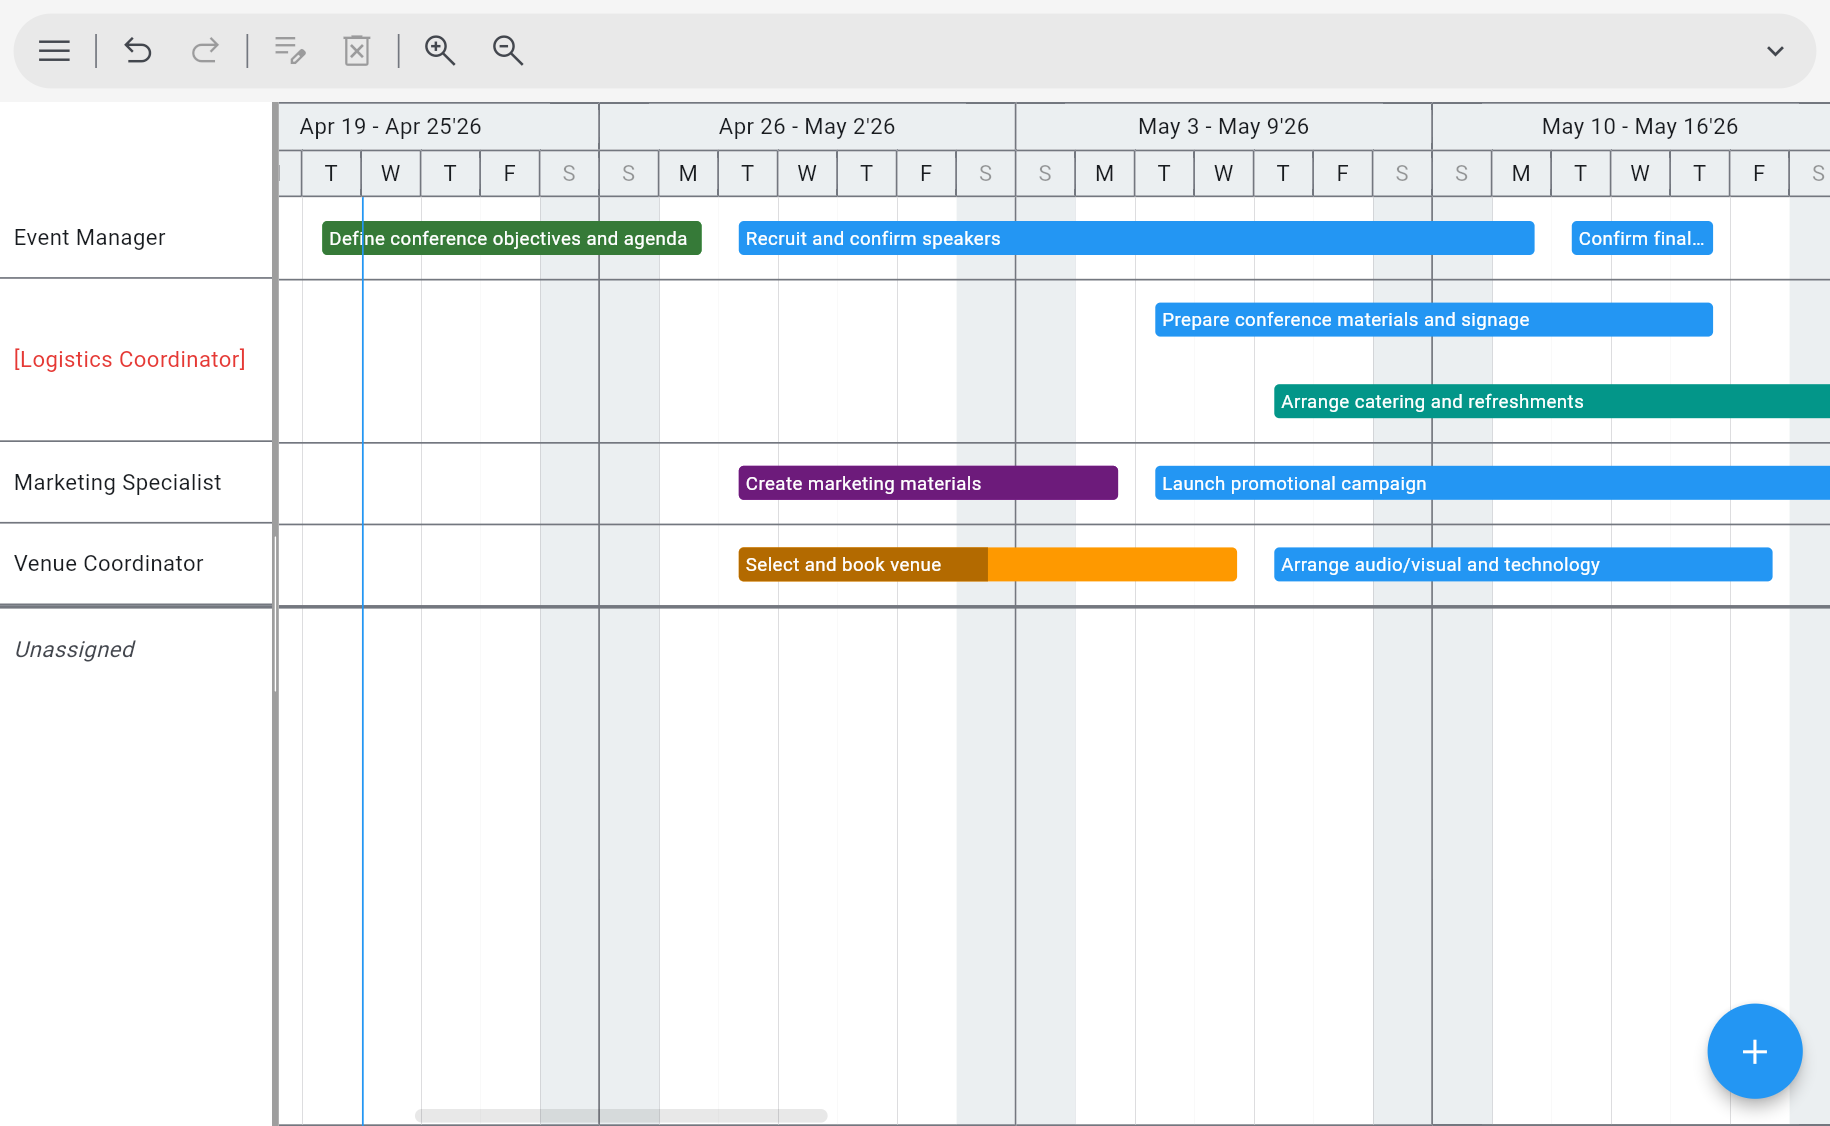
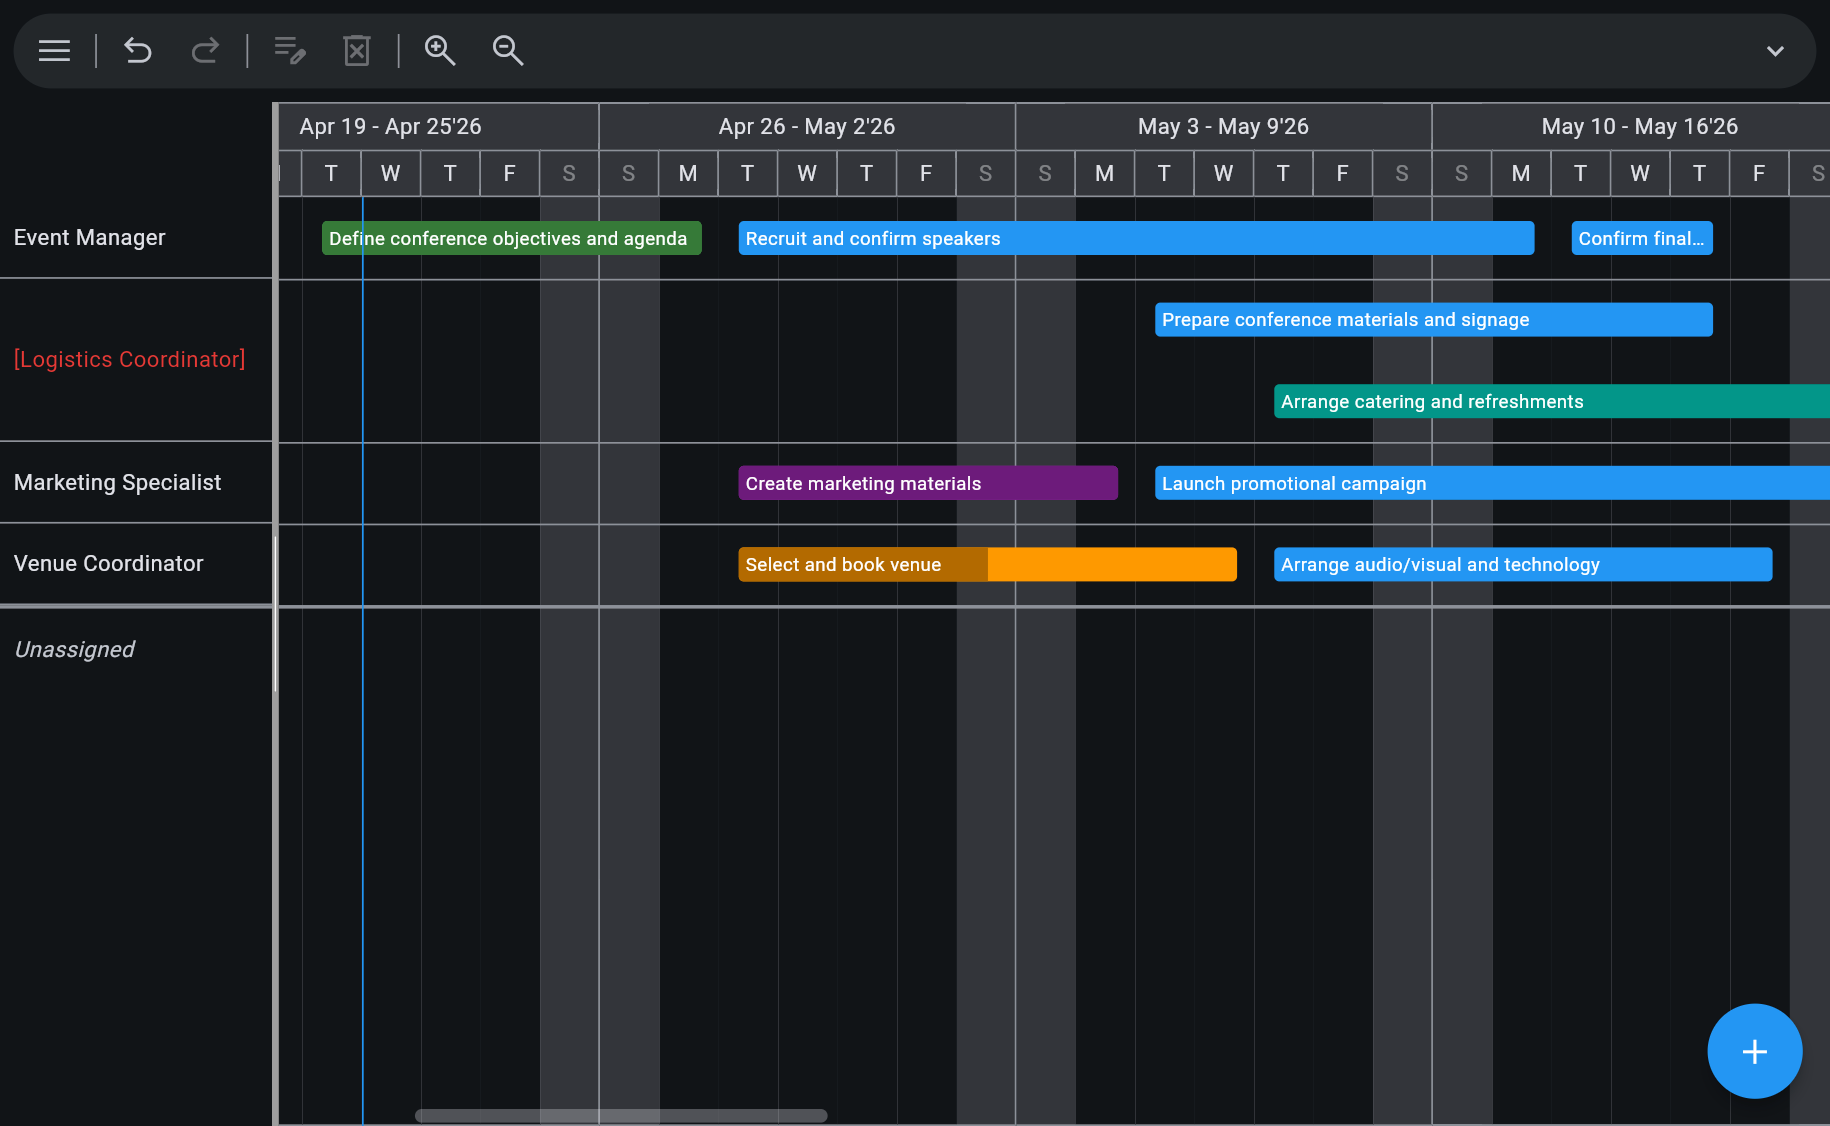
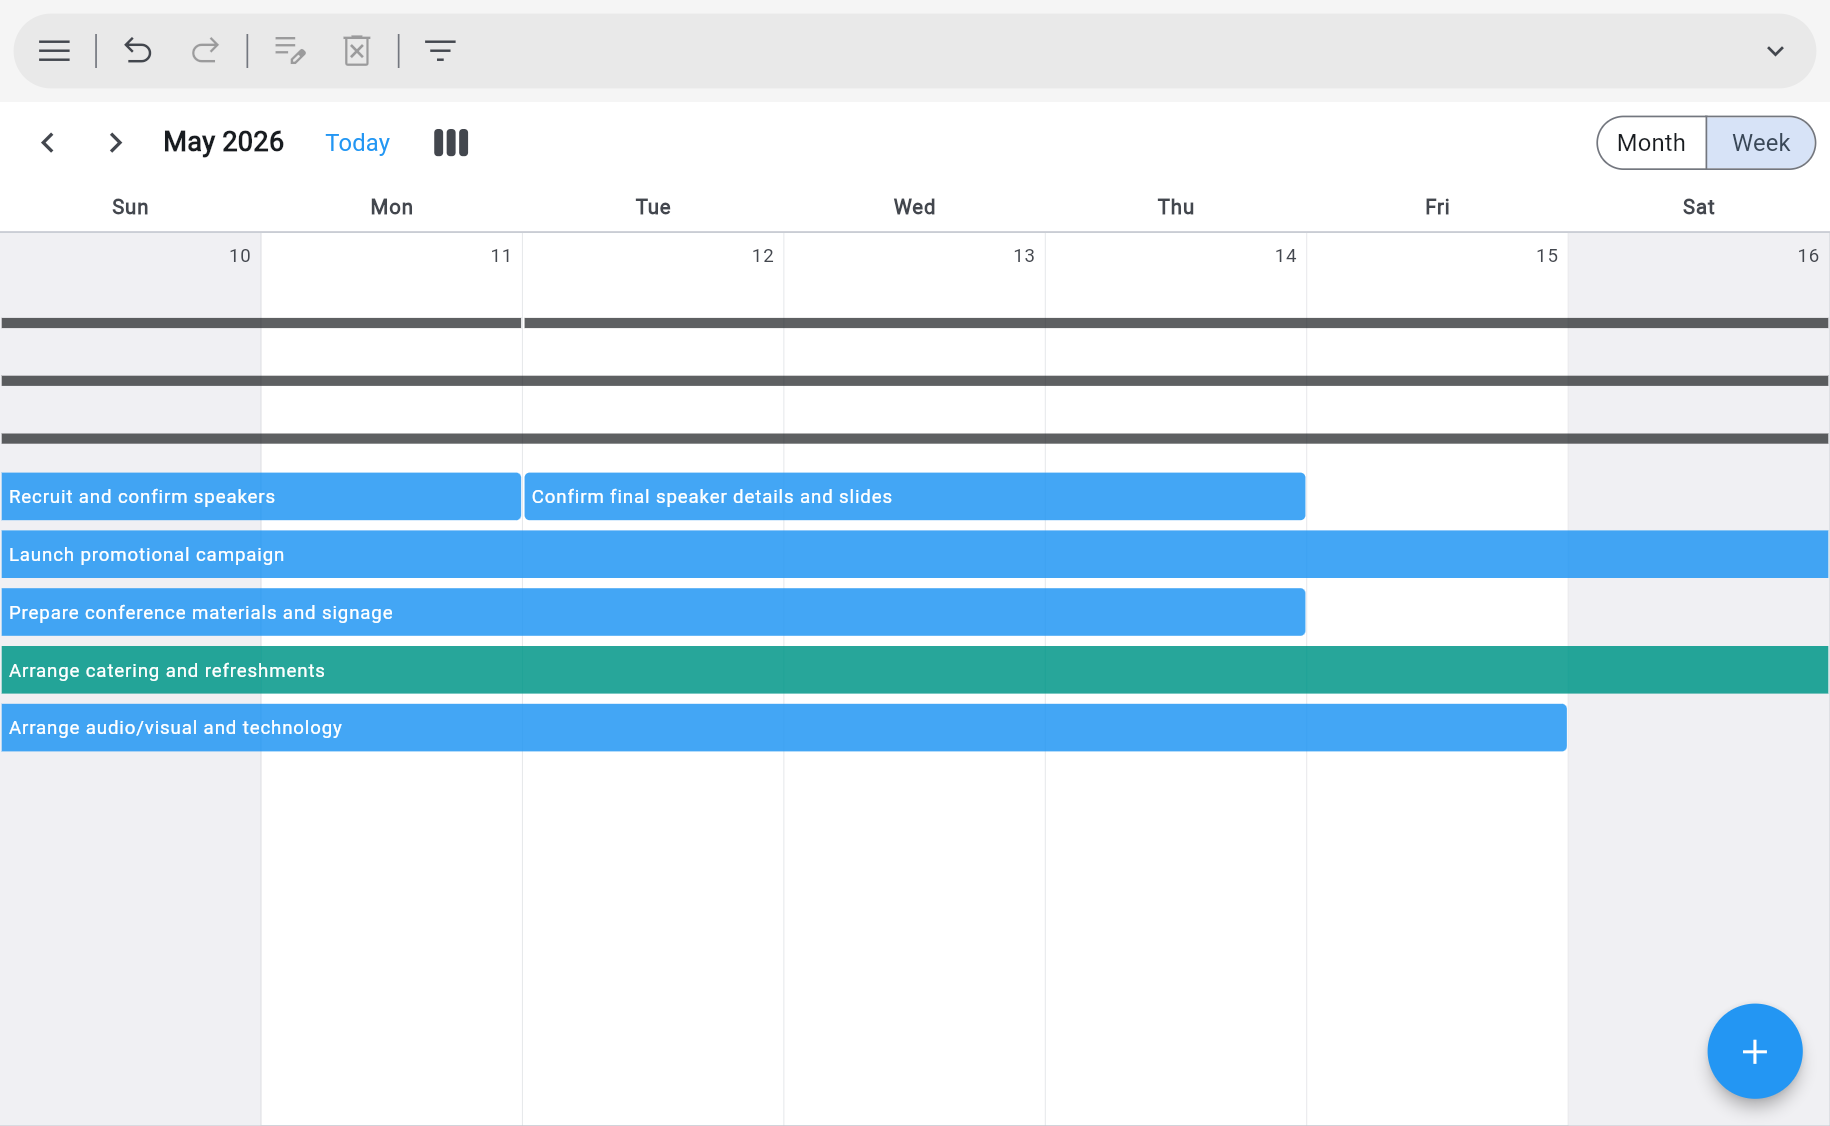
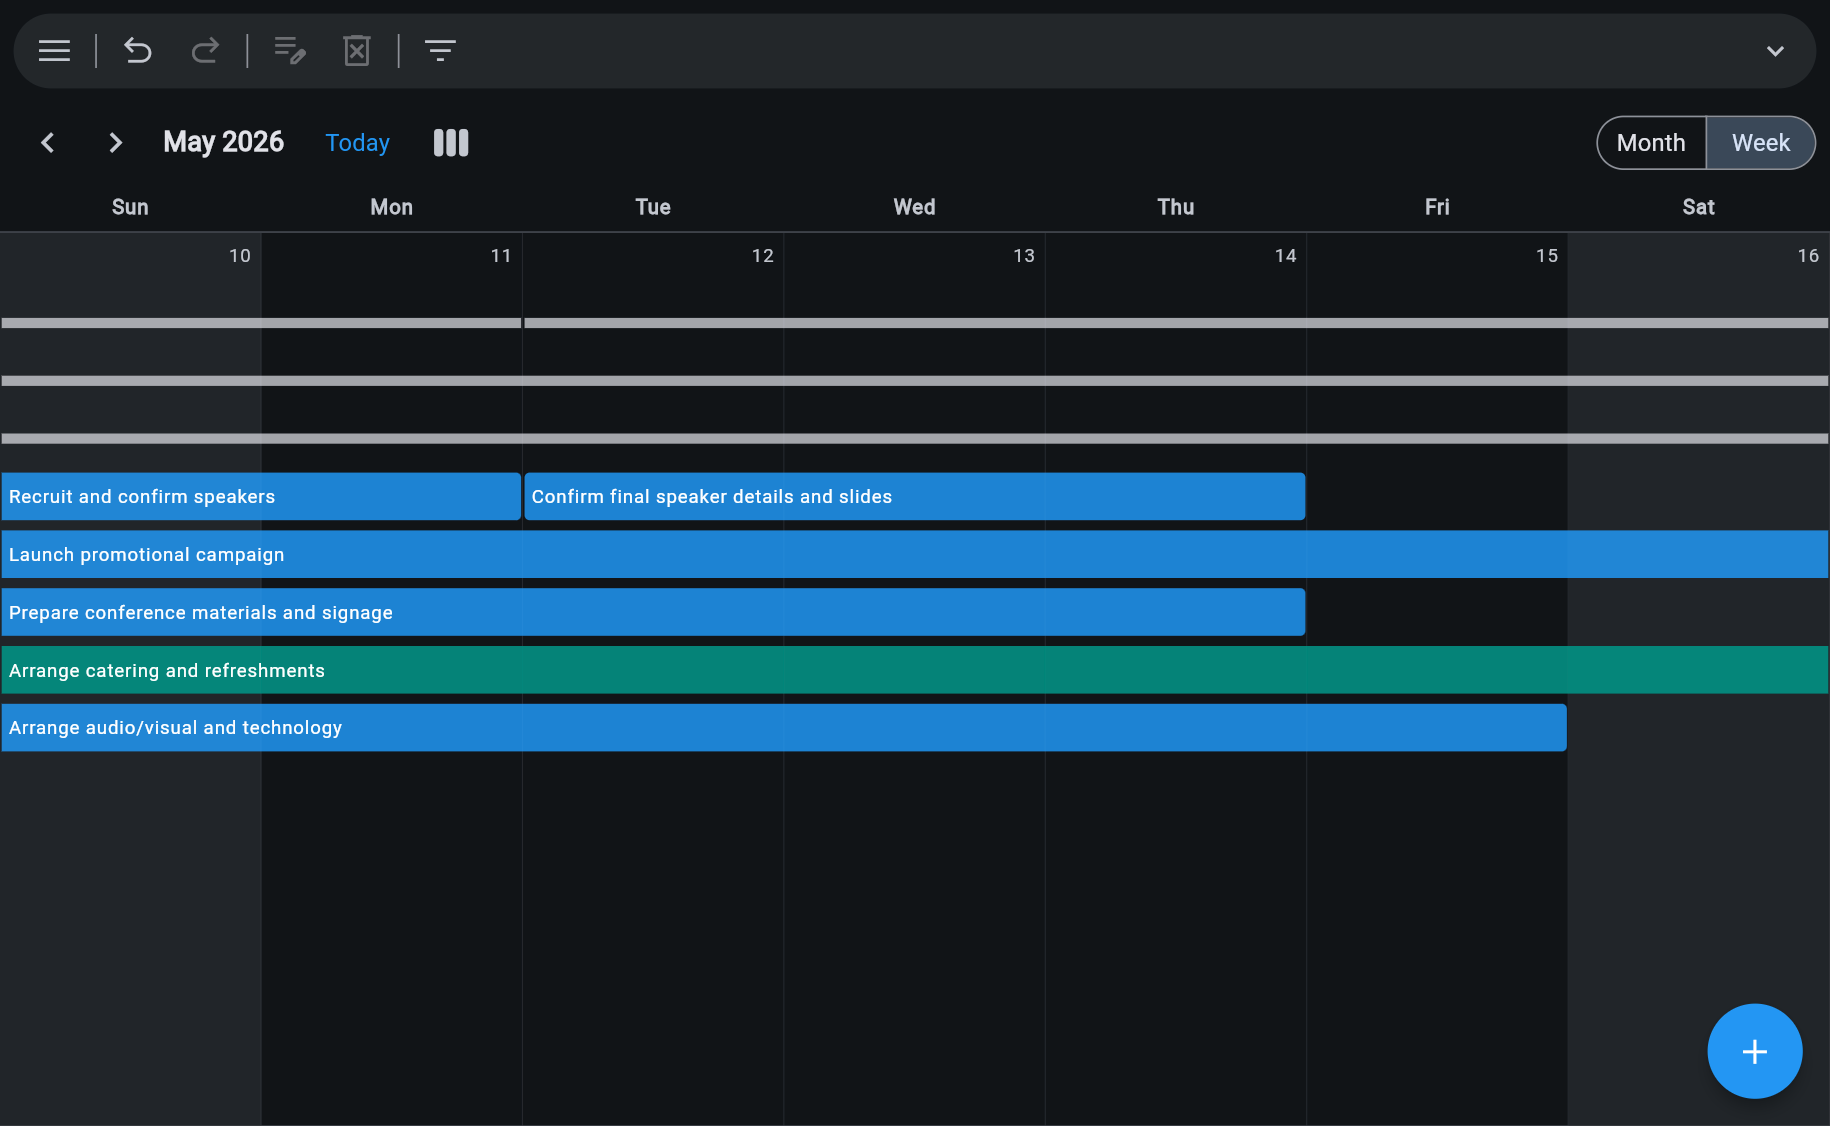
Plan the time
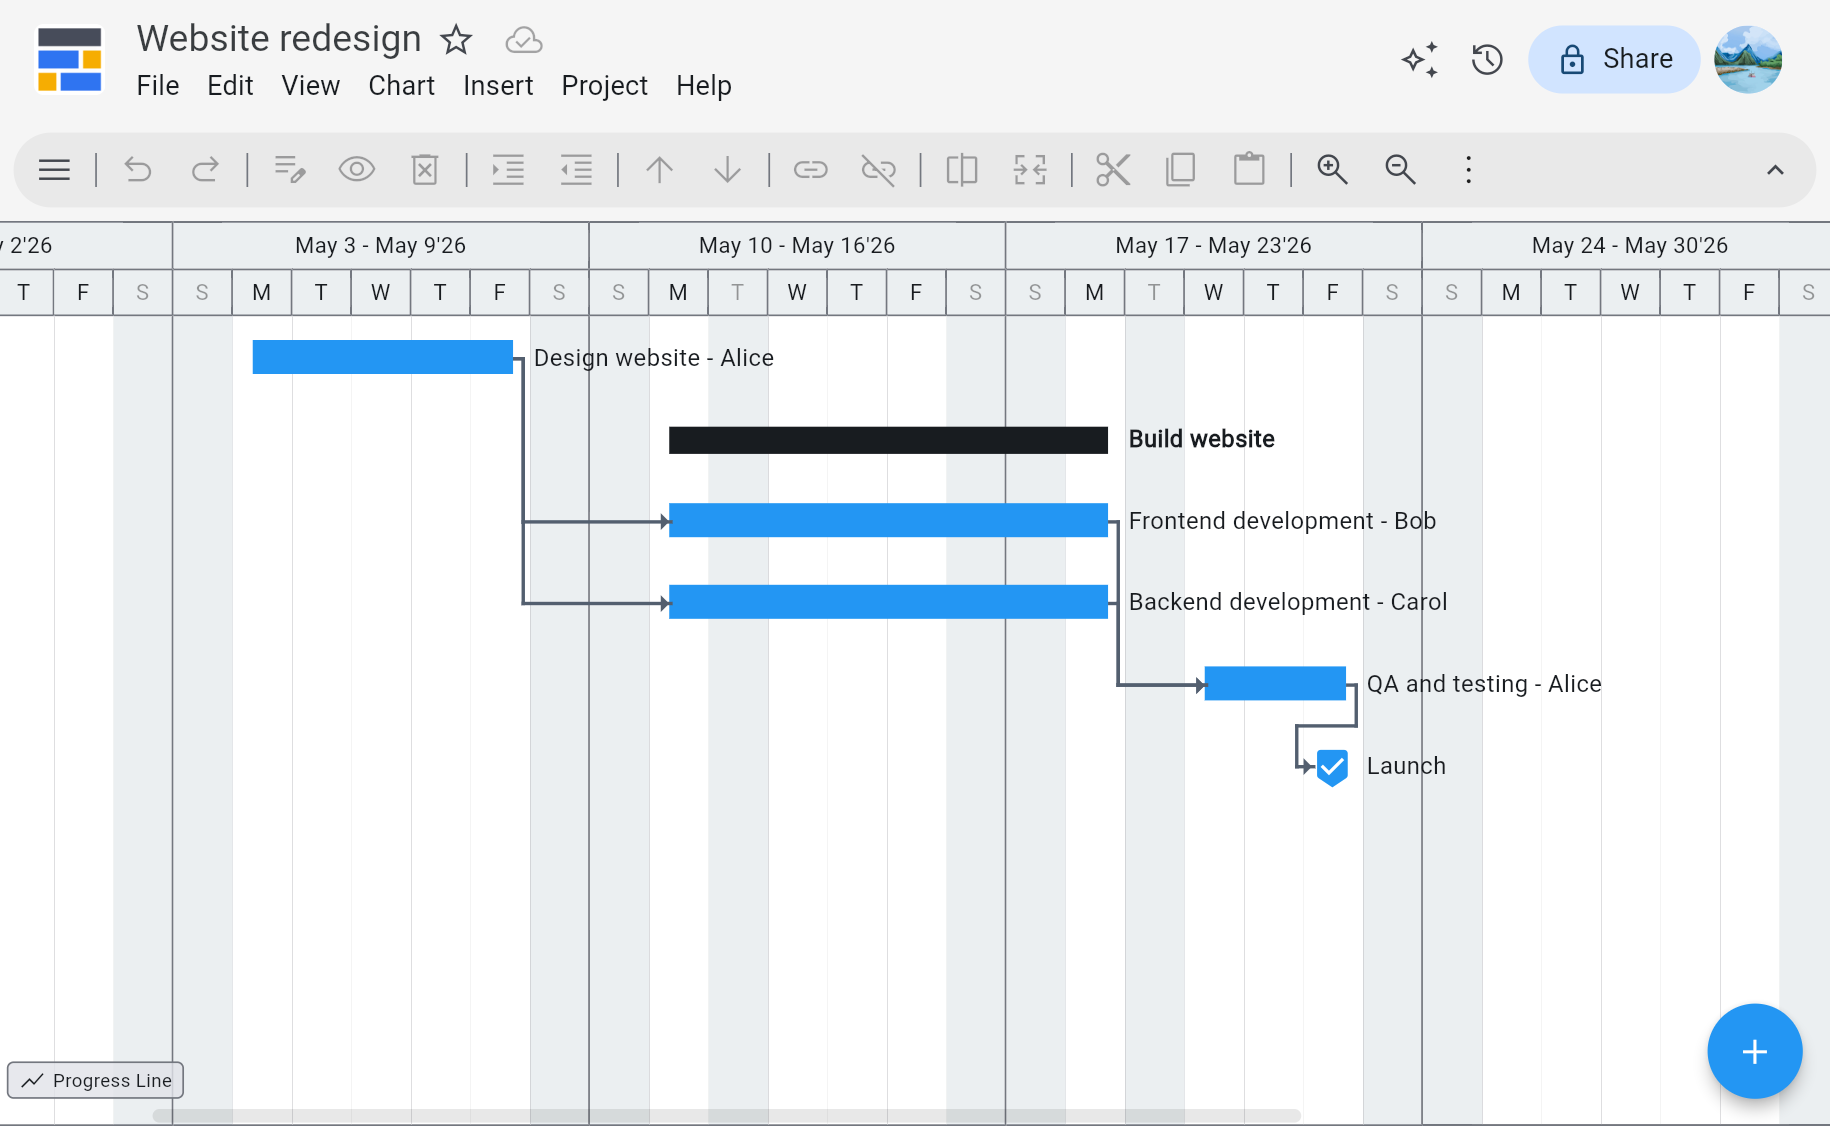
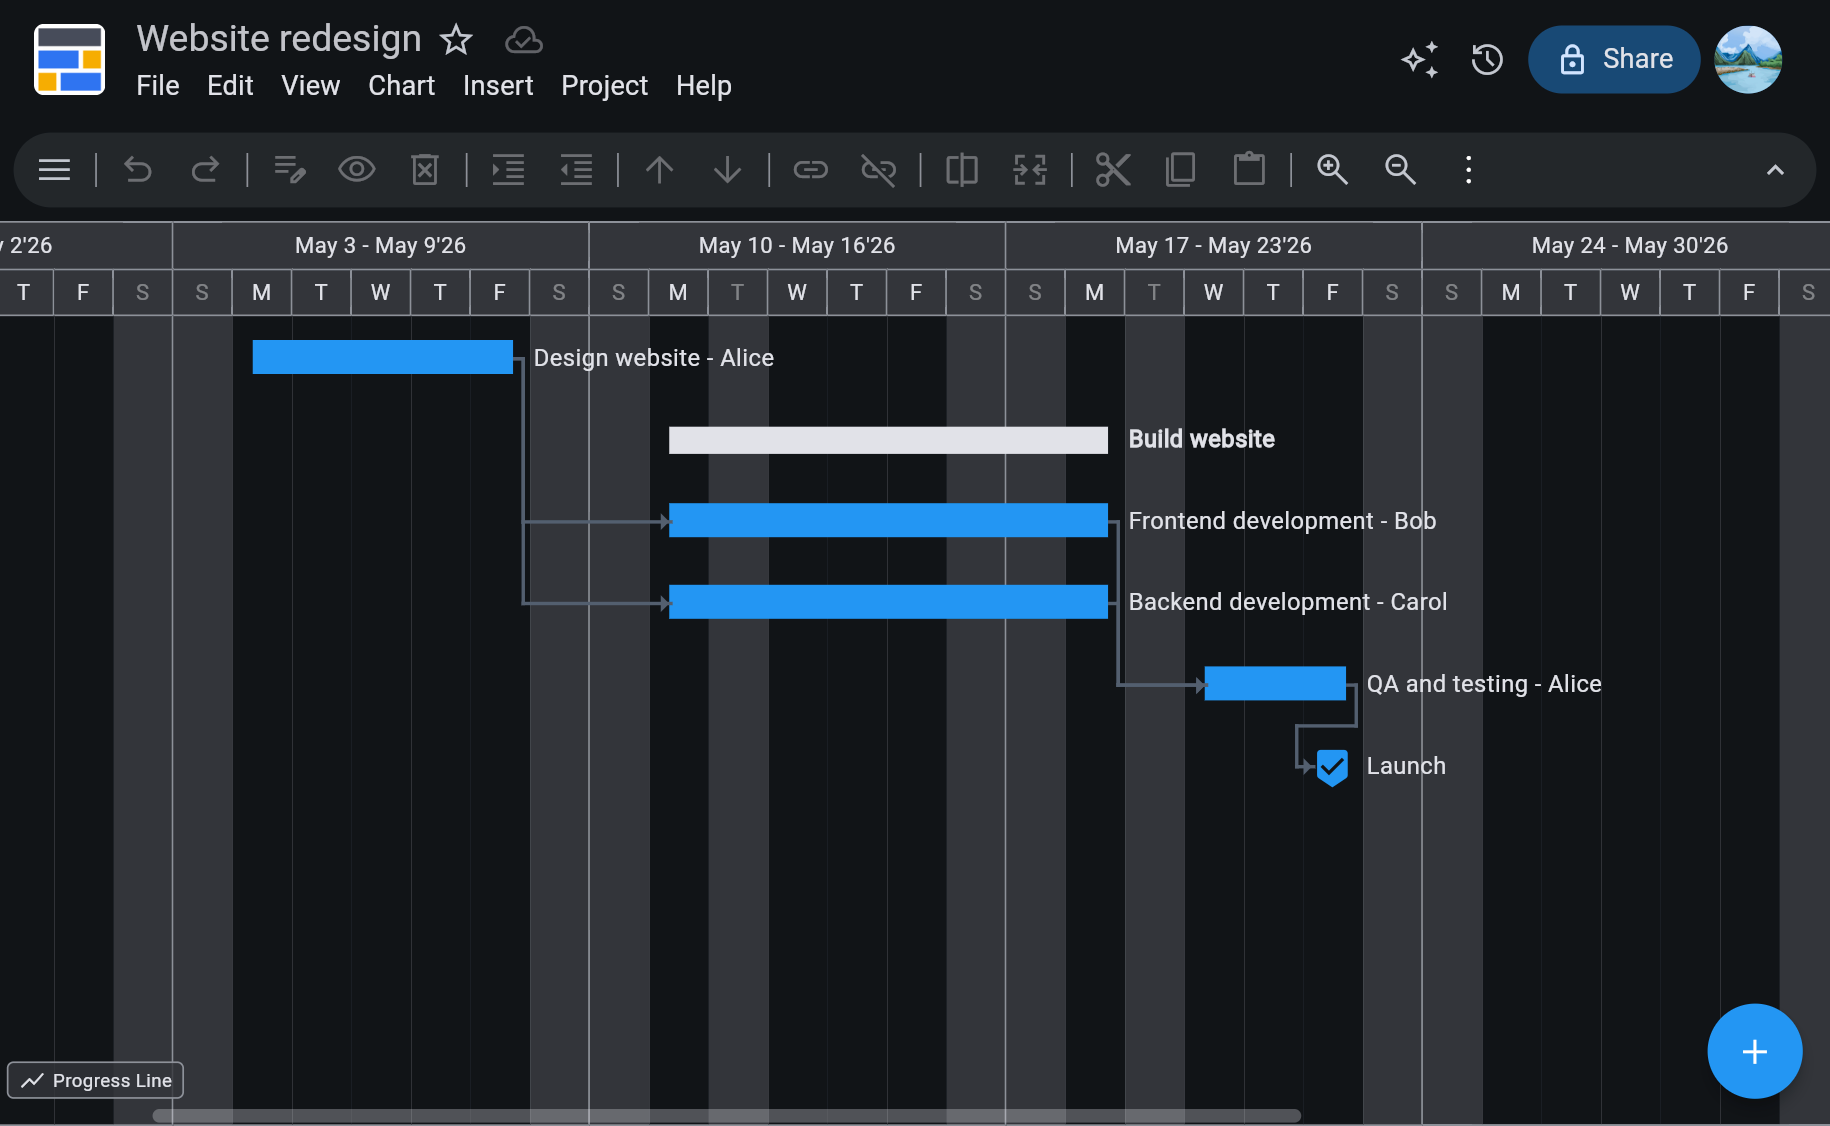
When will this actually be done?
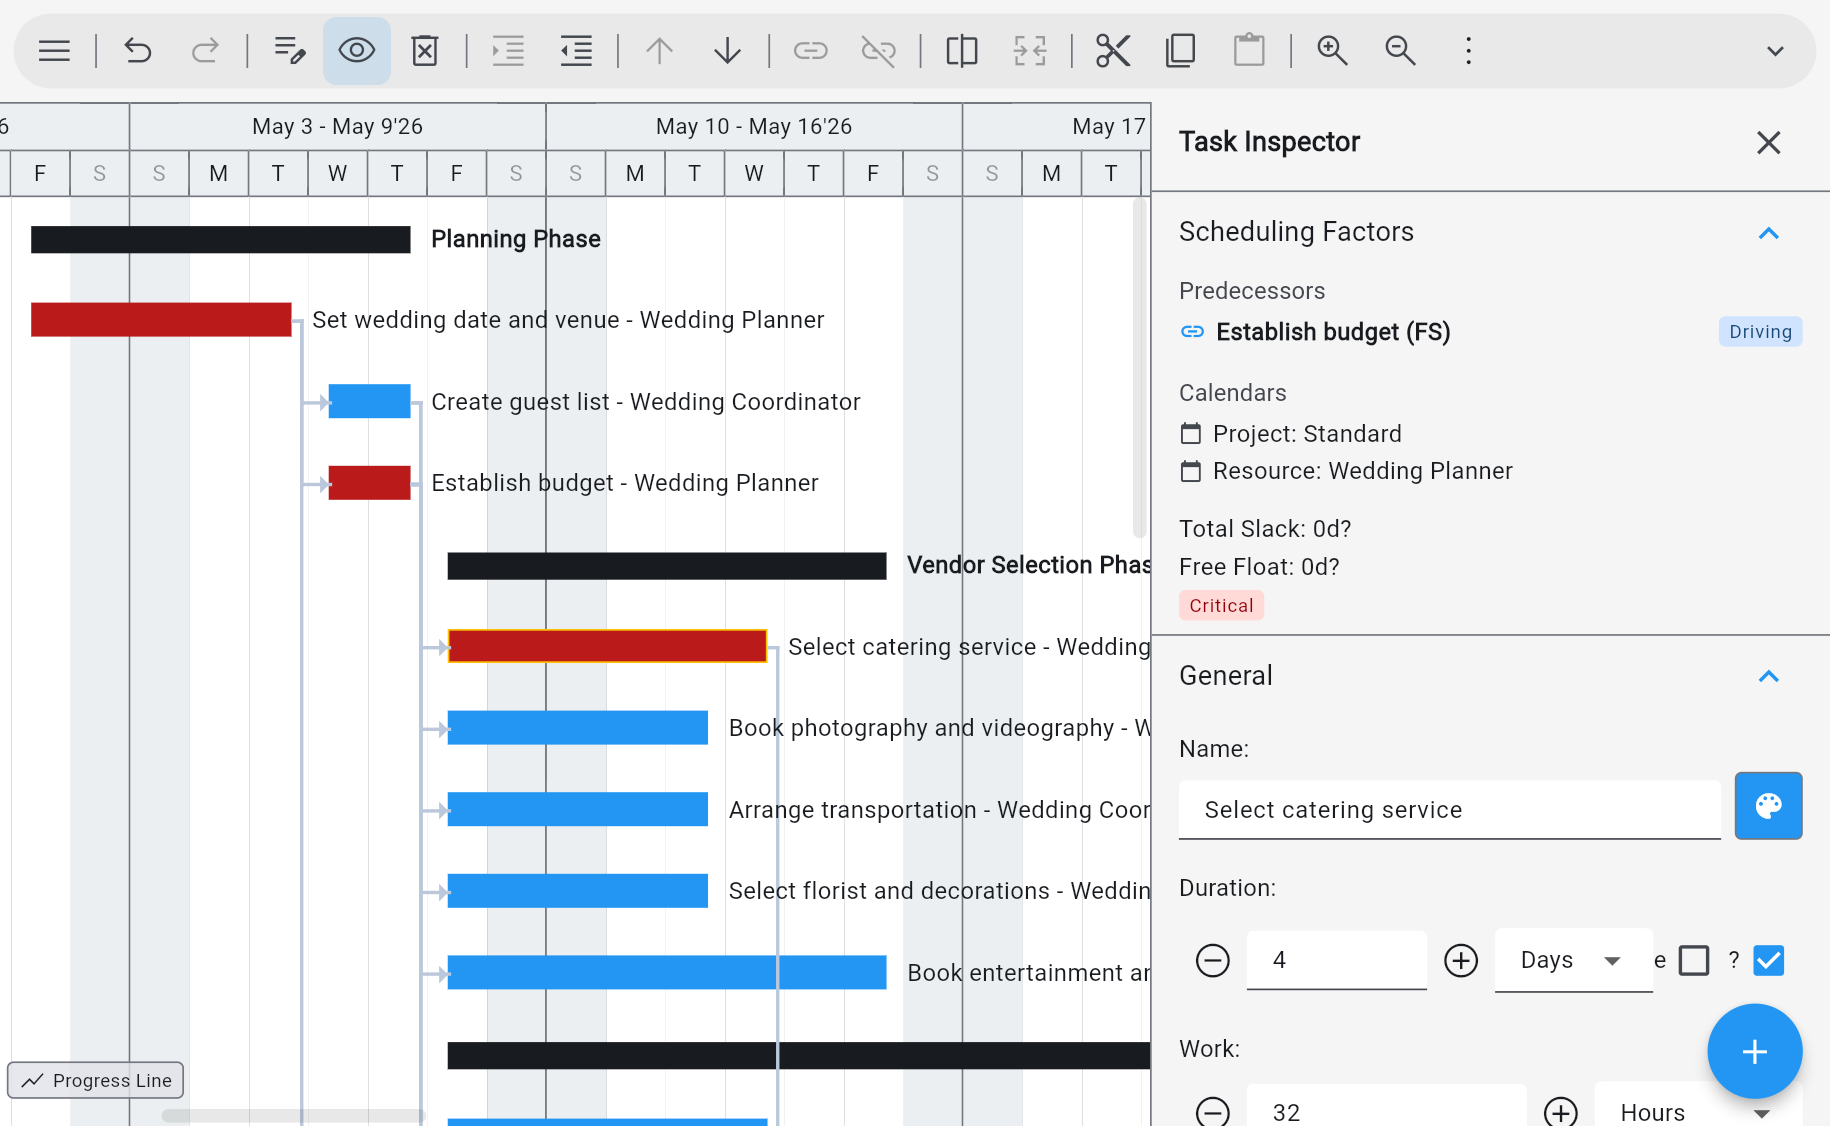
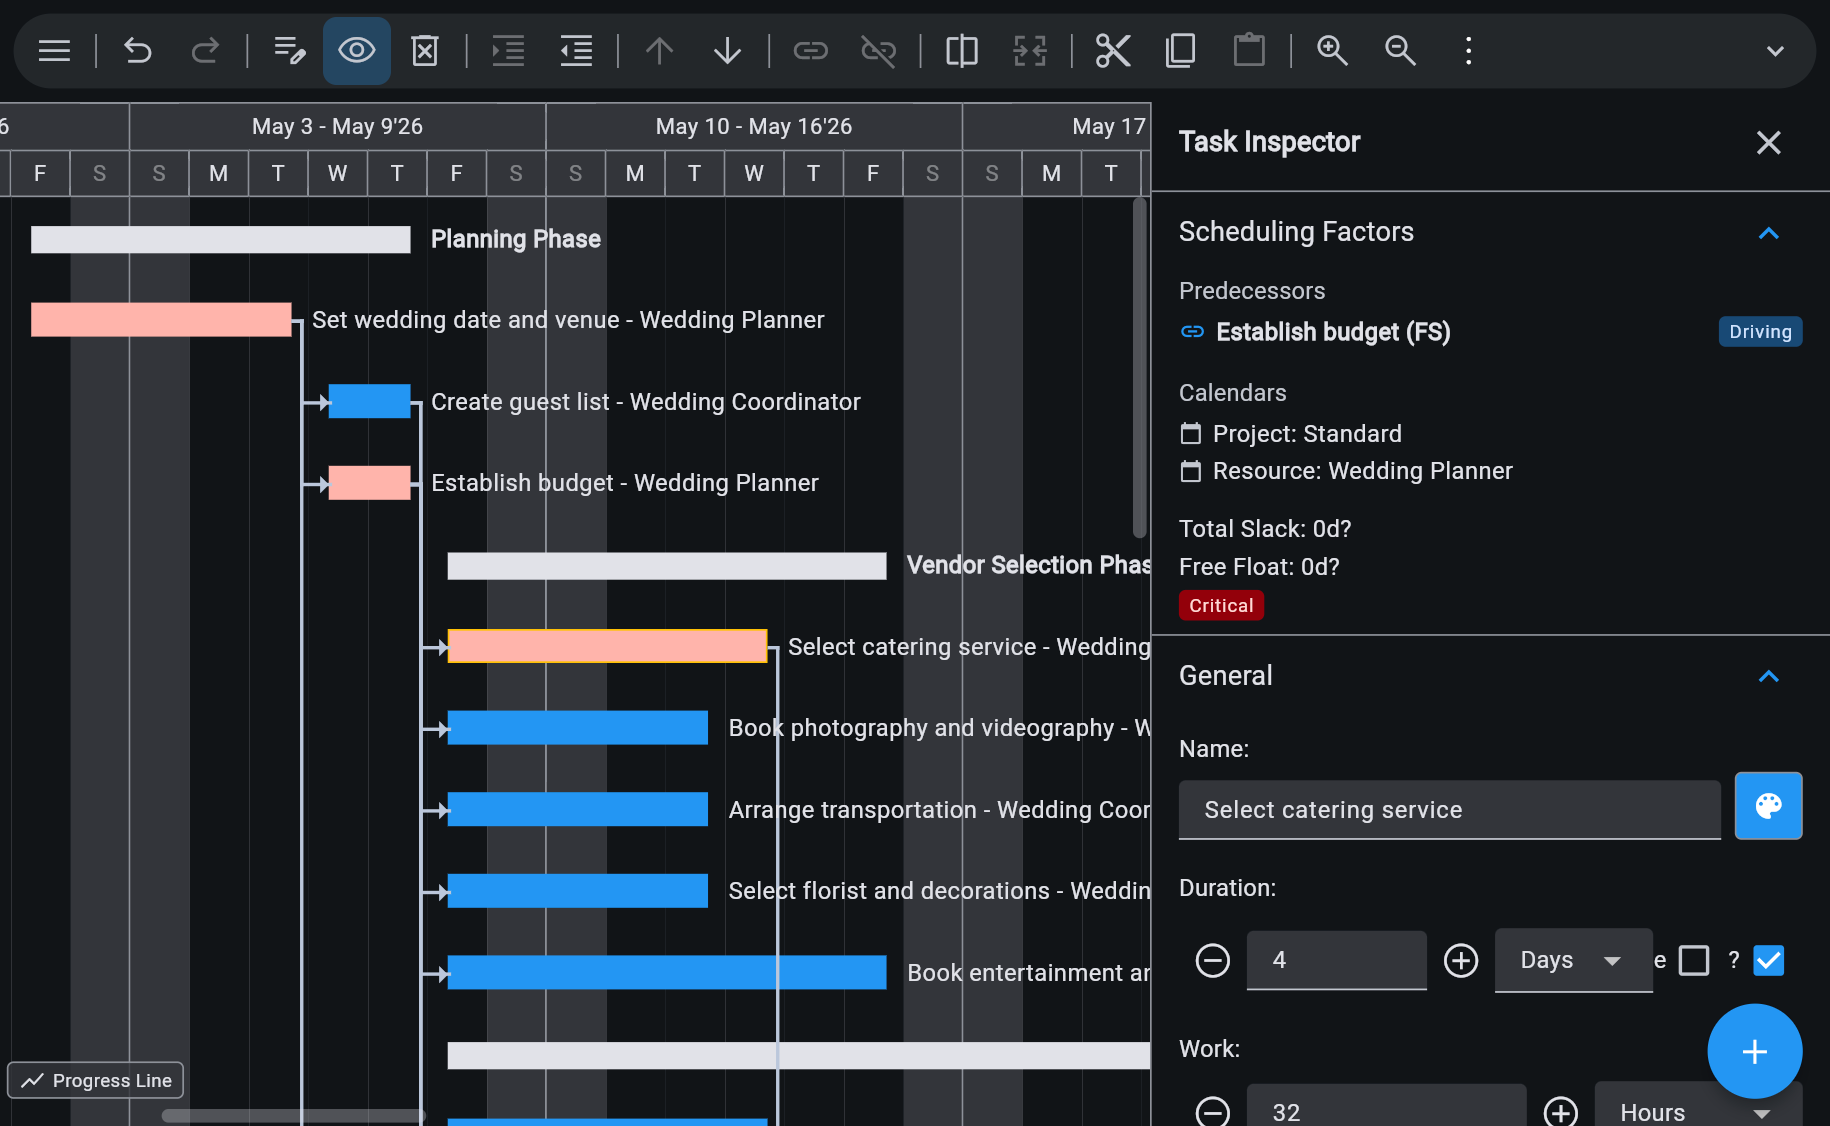
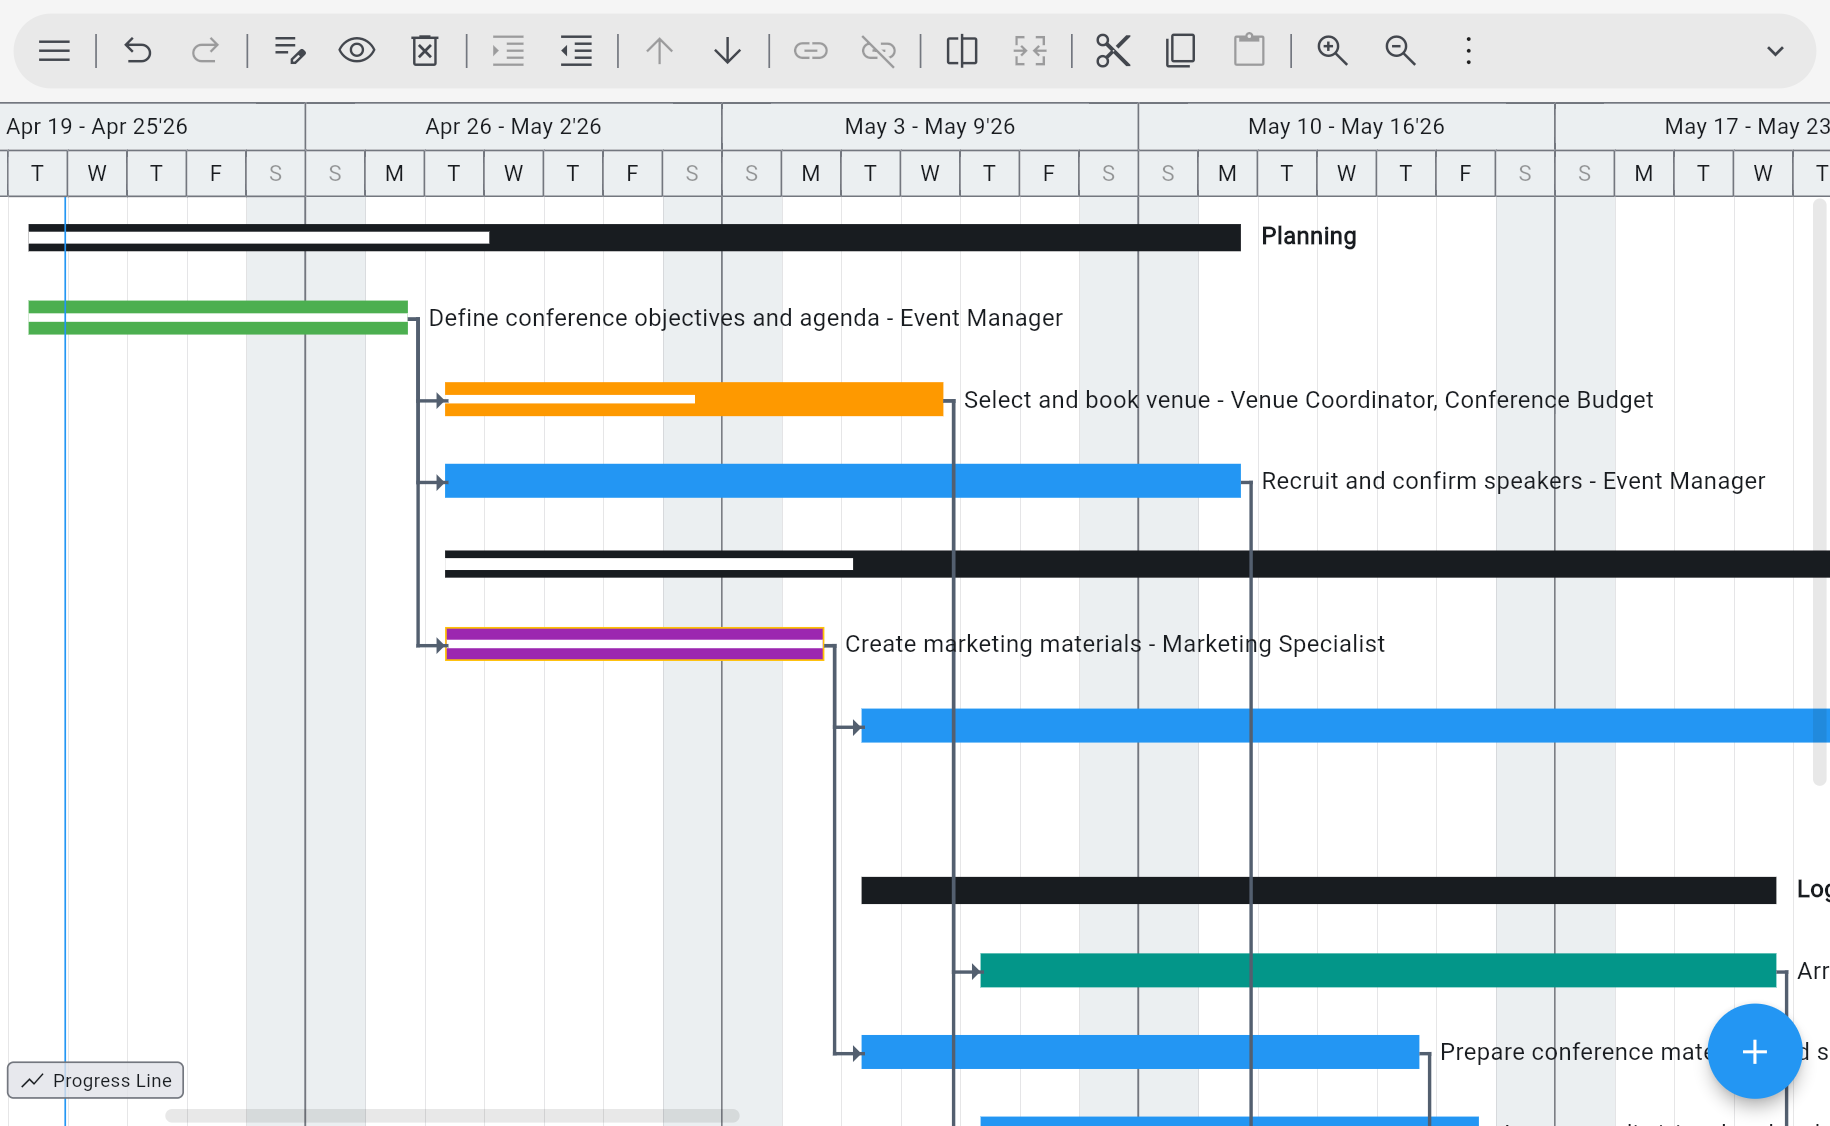
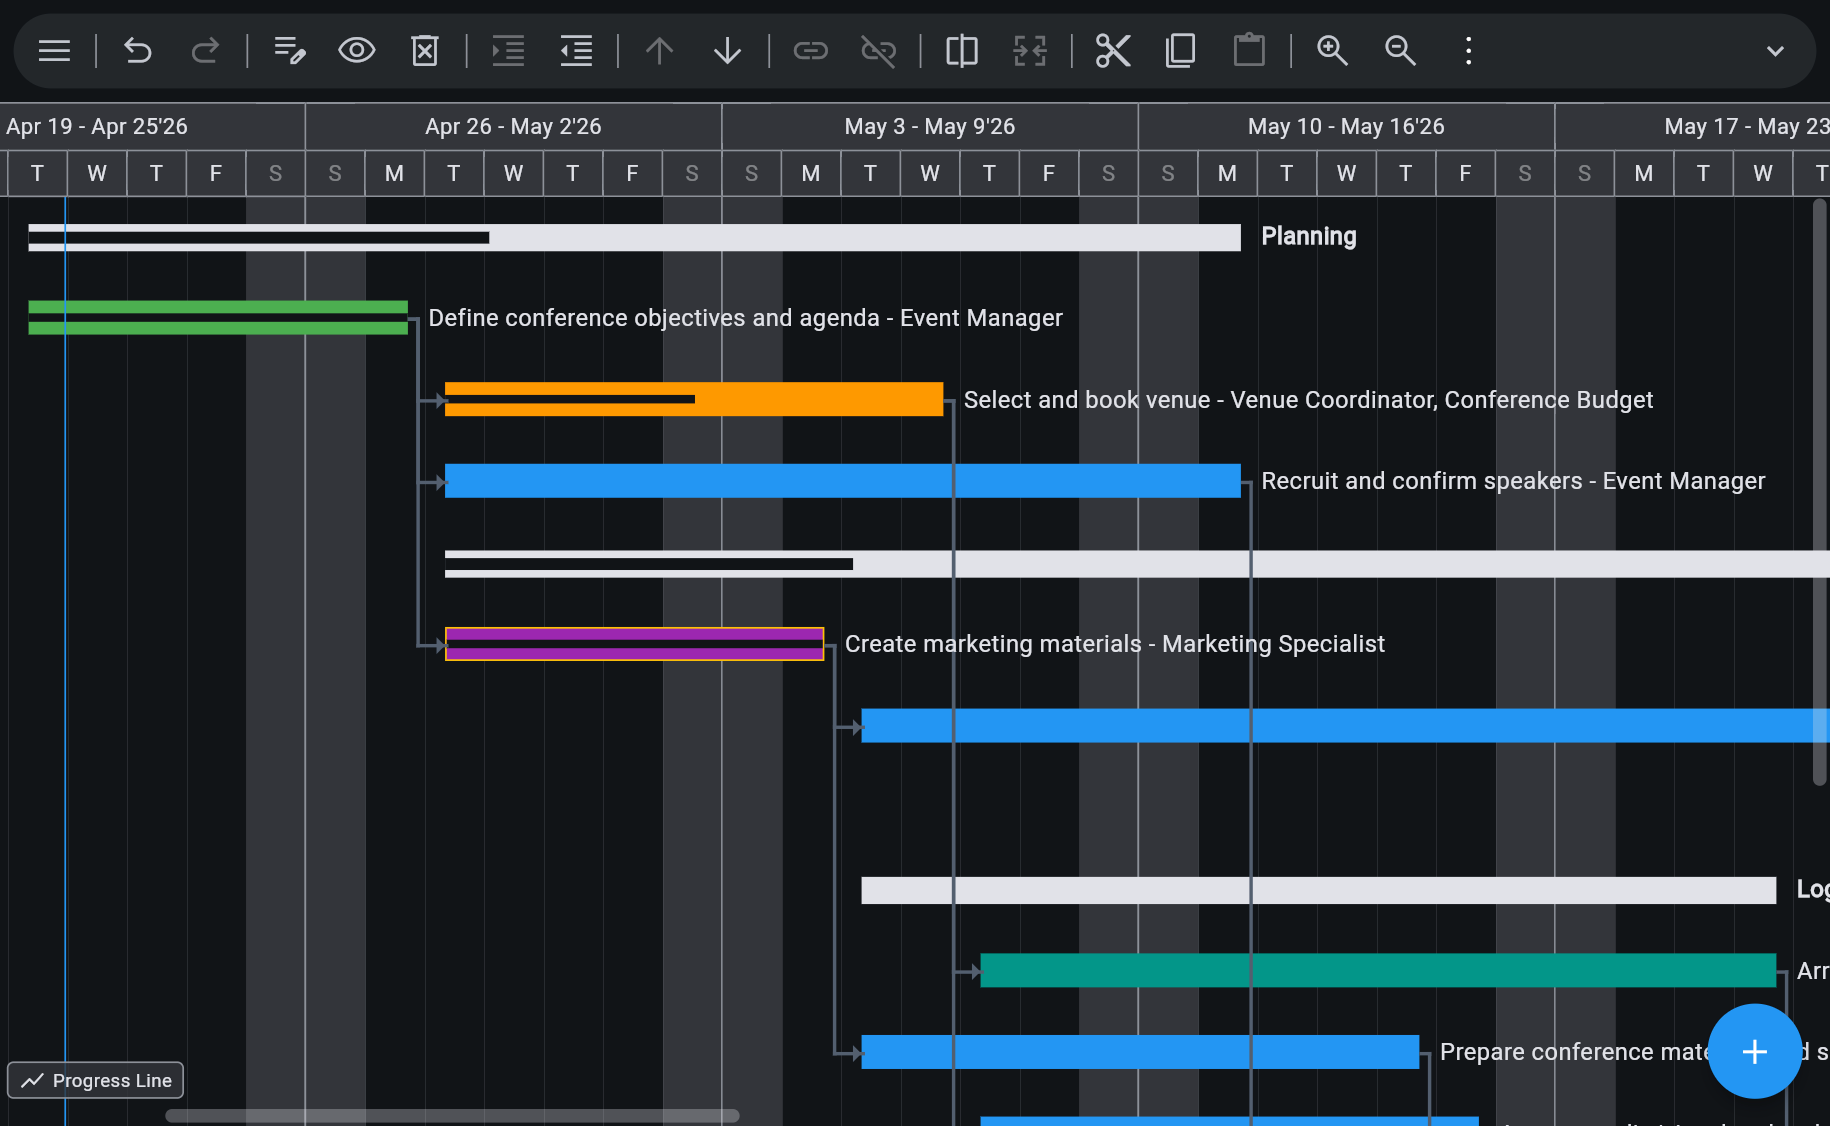
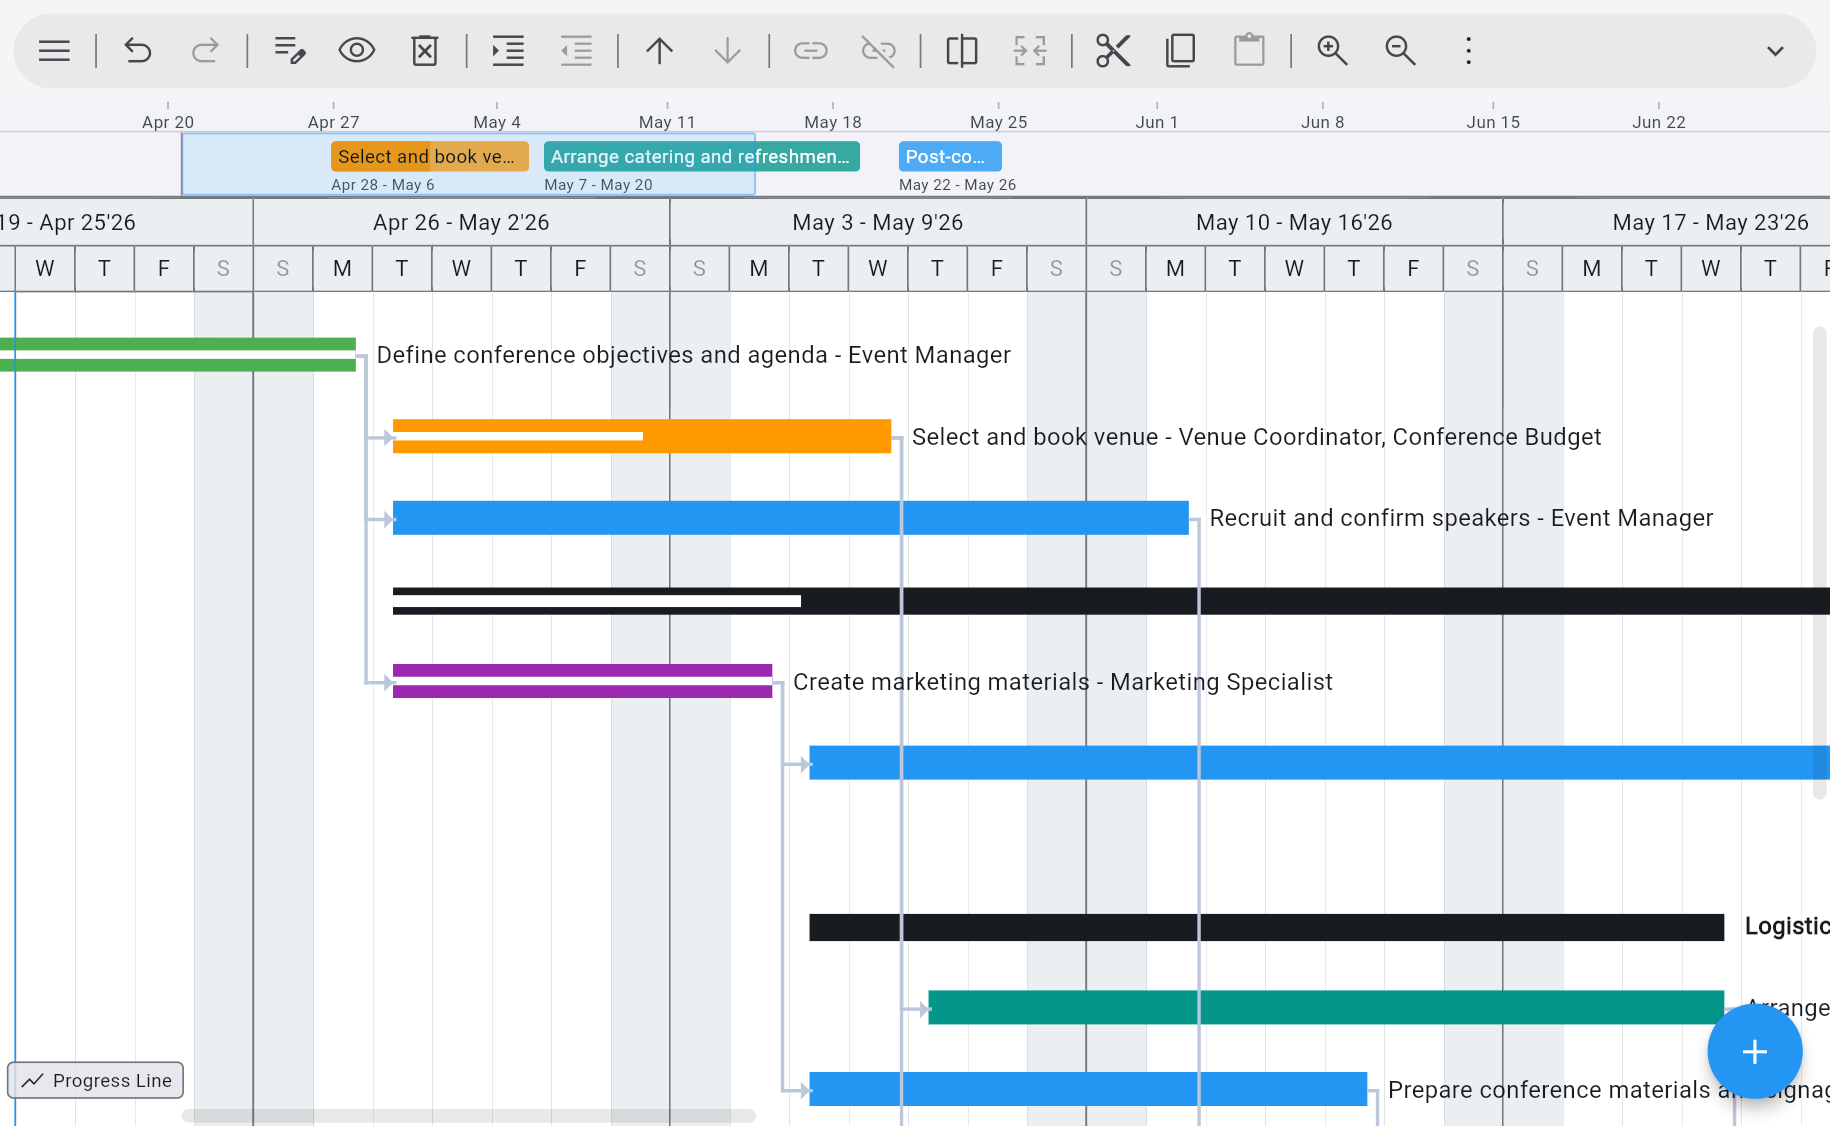
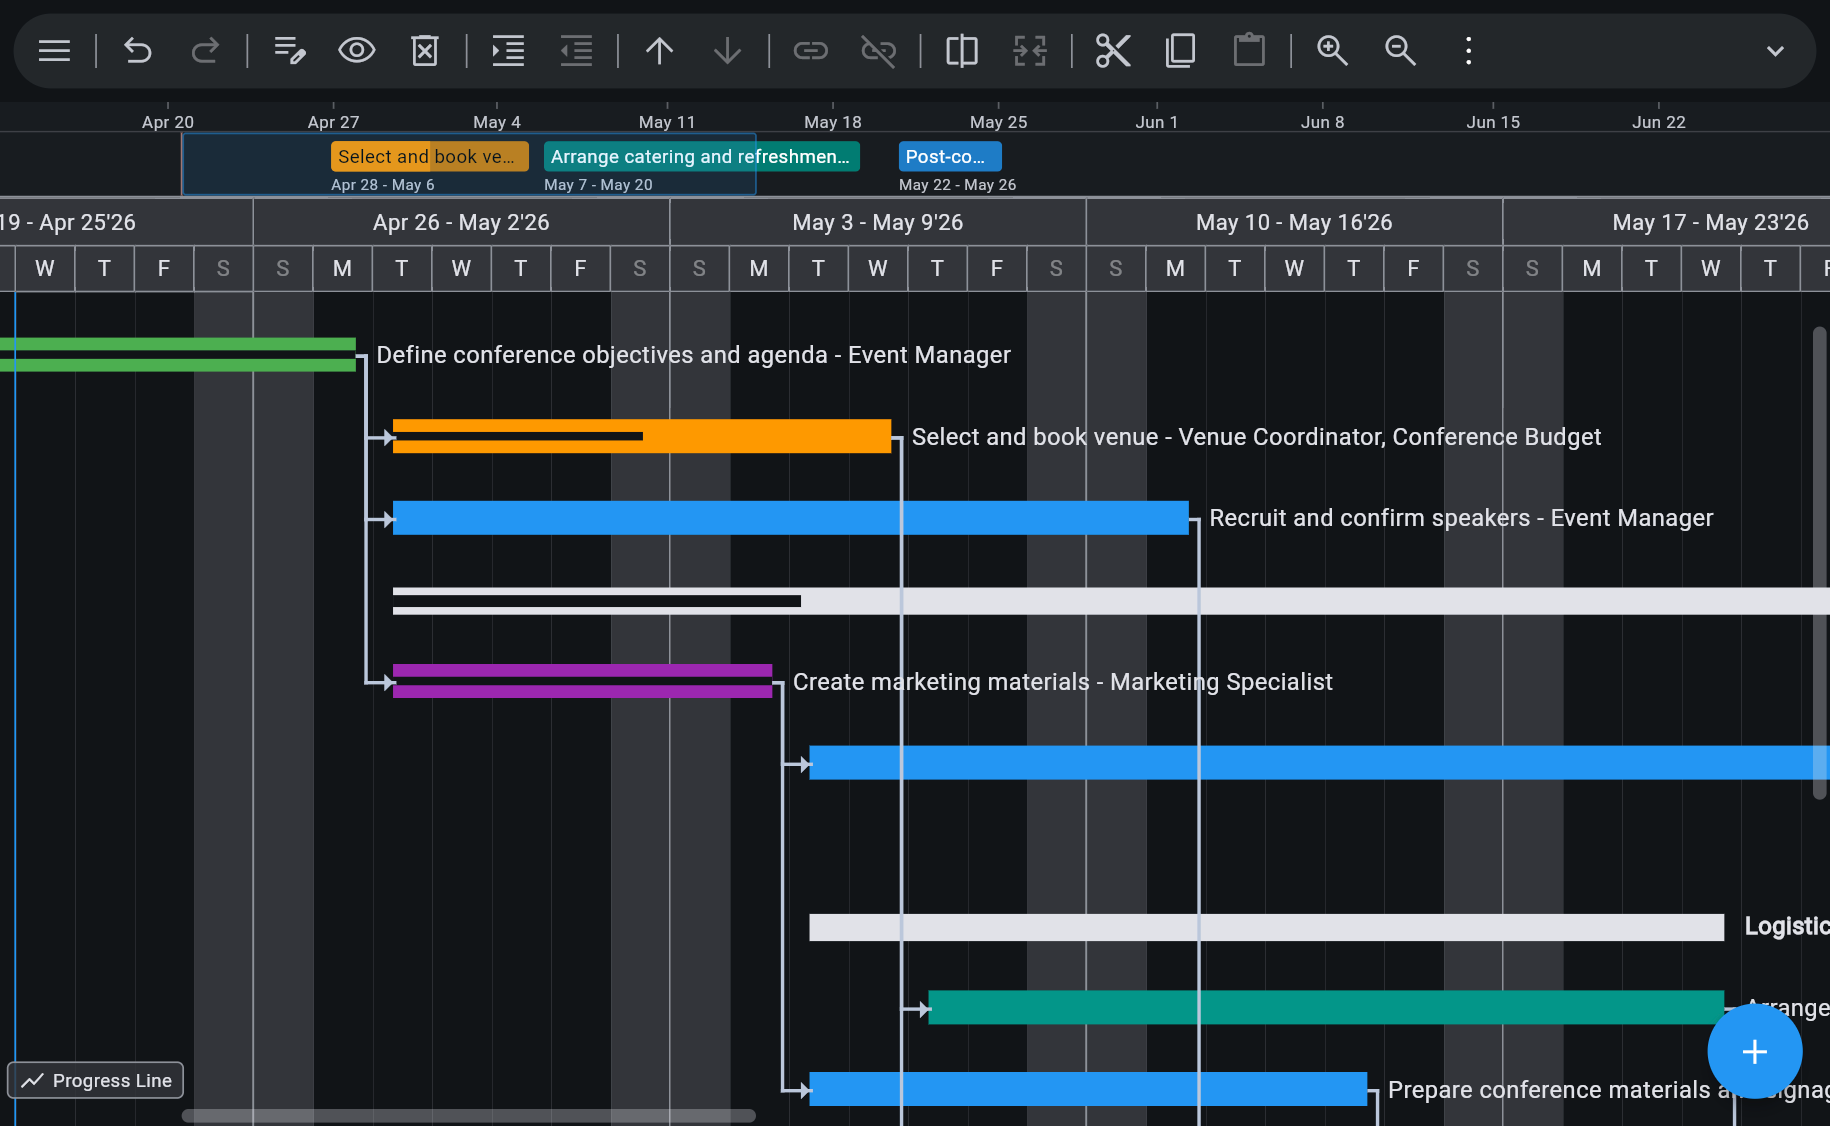
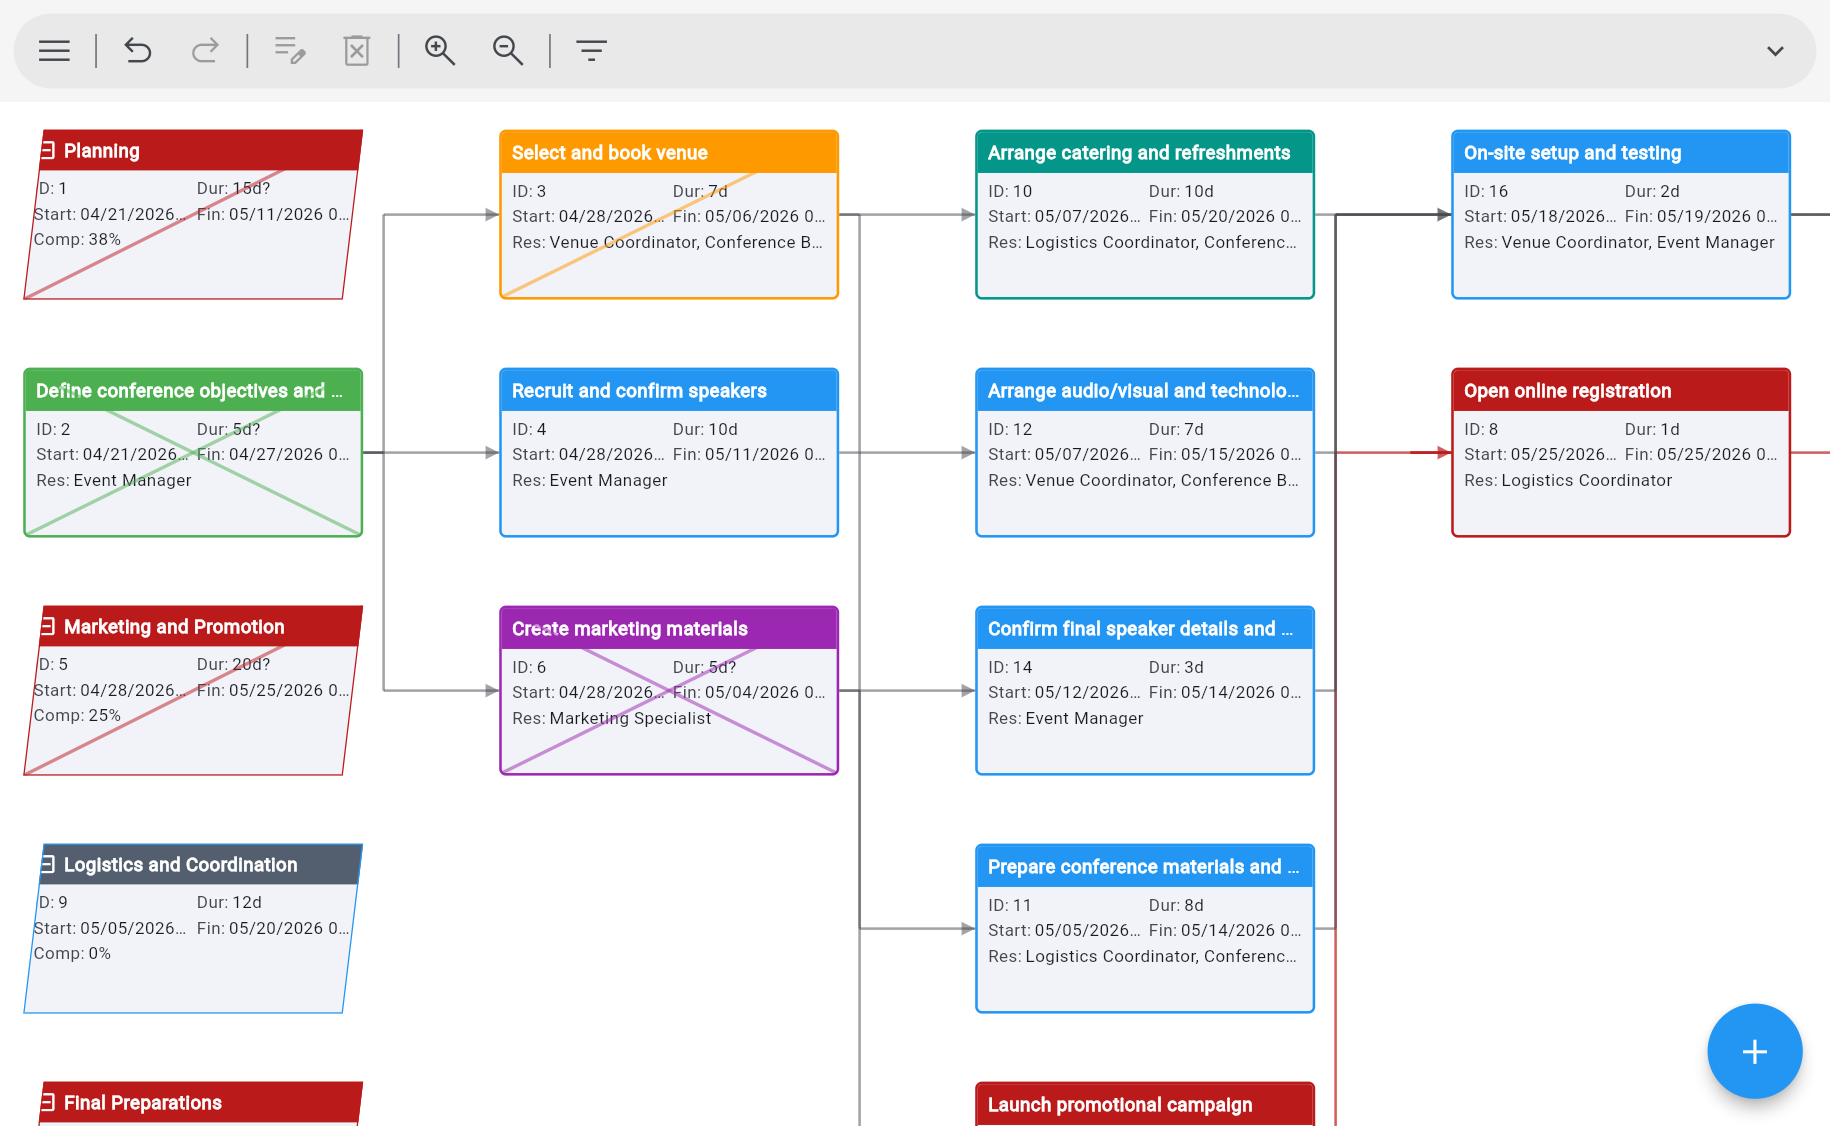
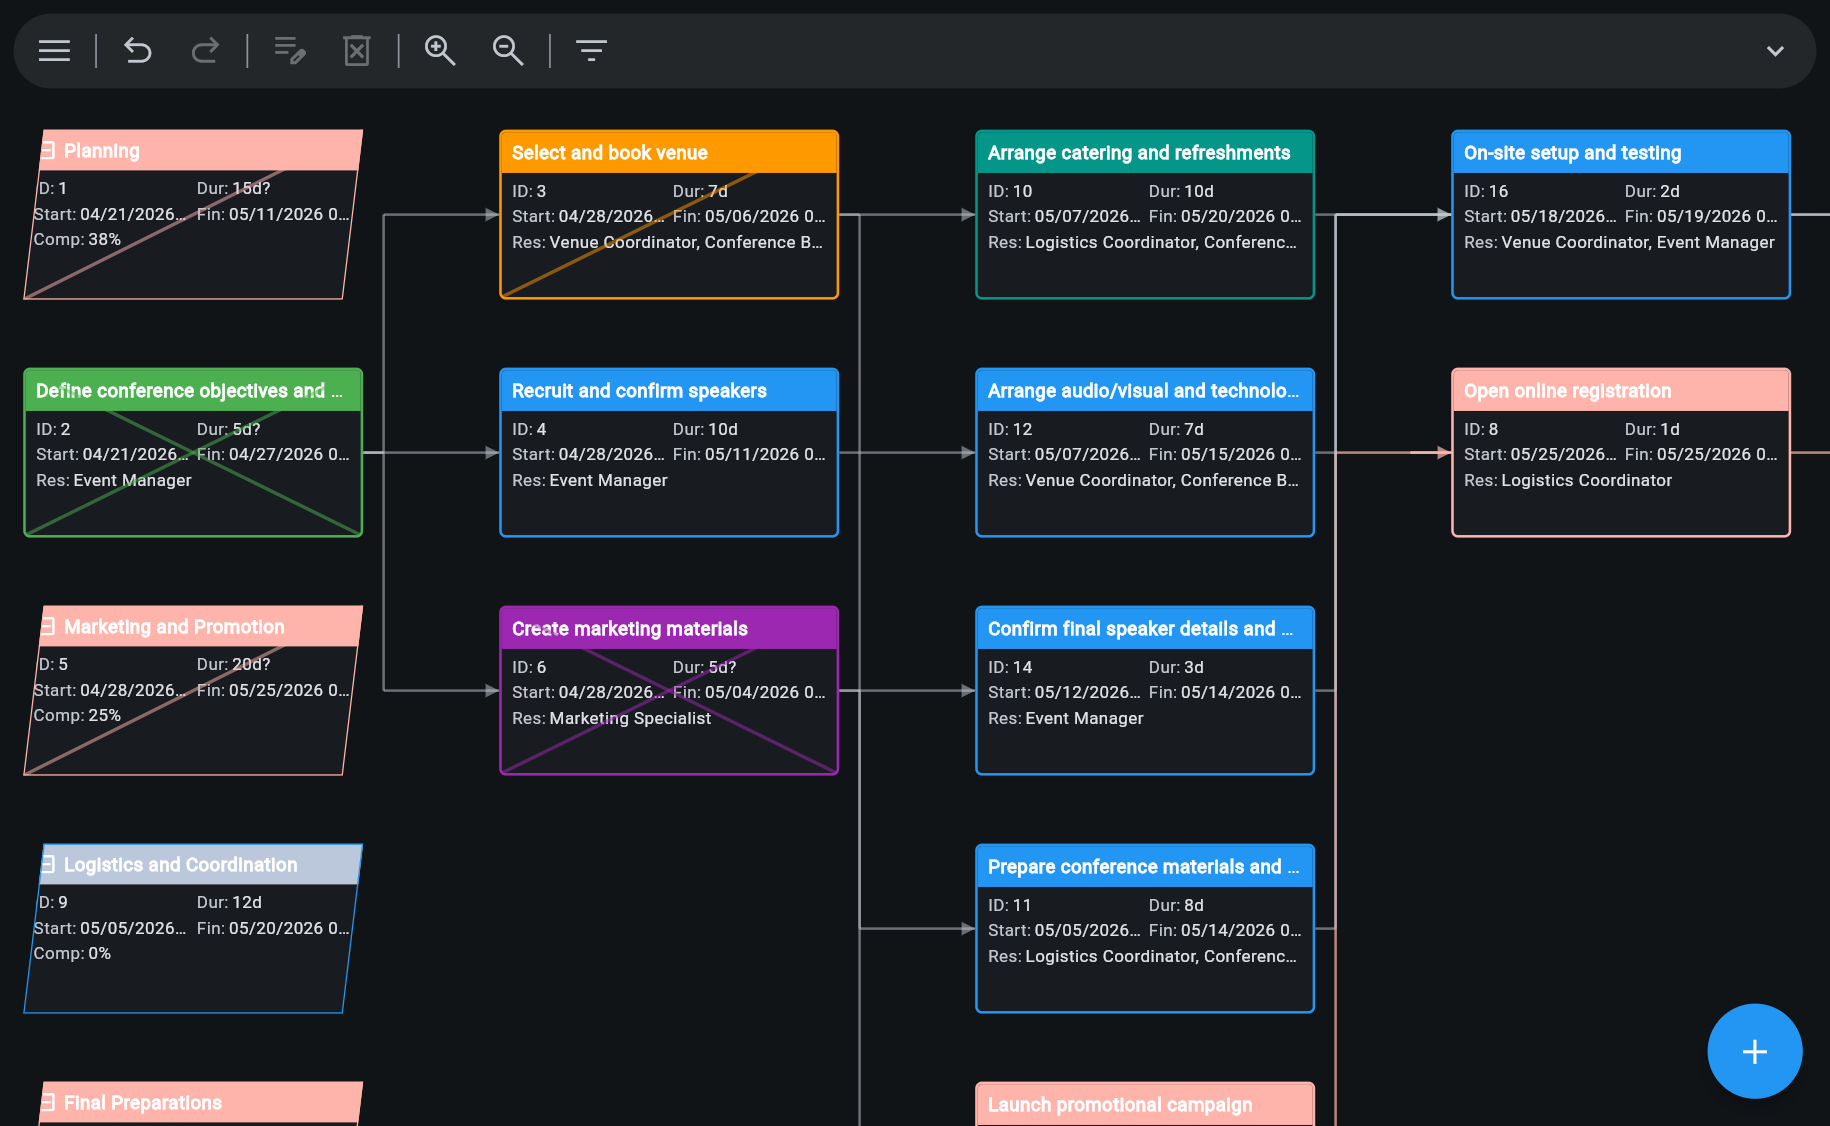
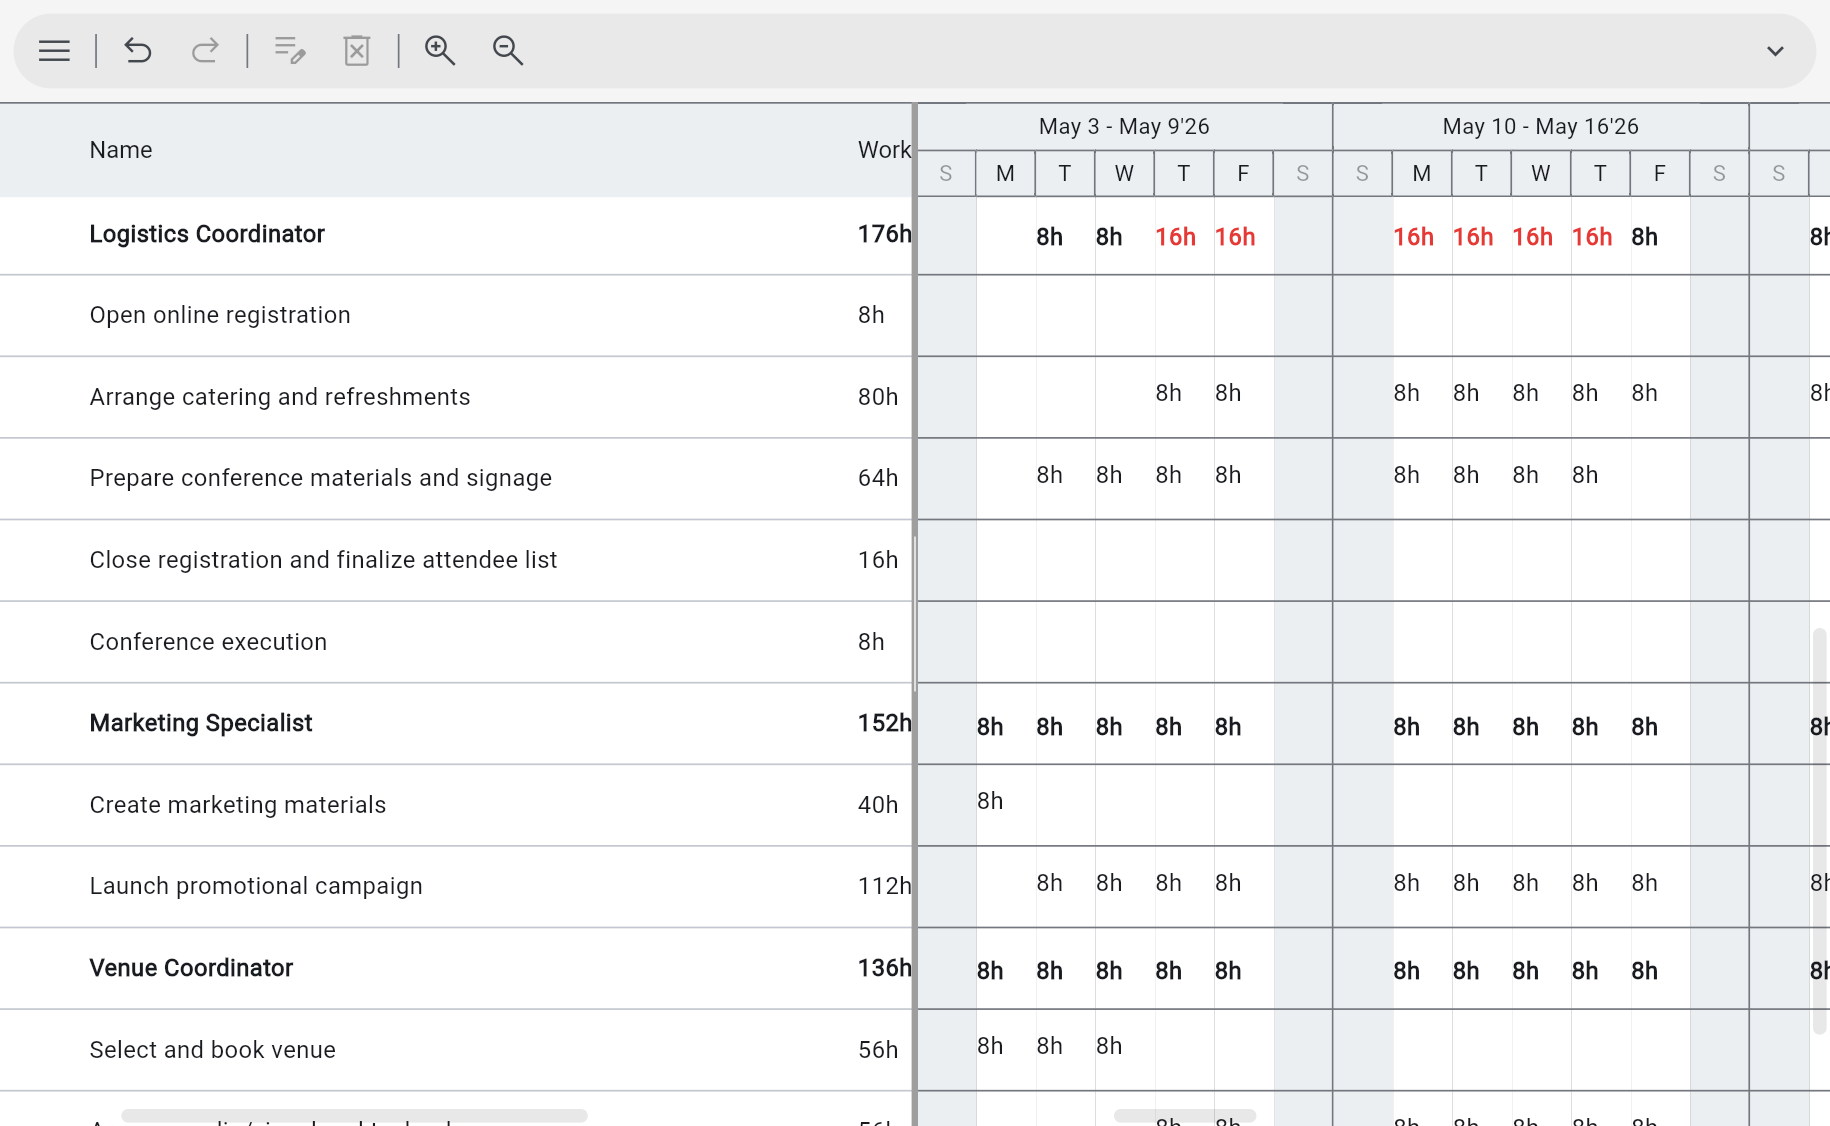
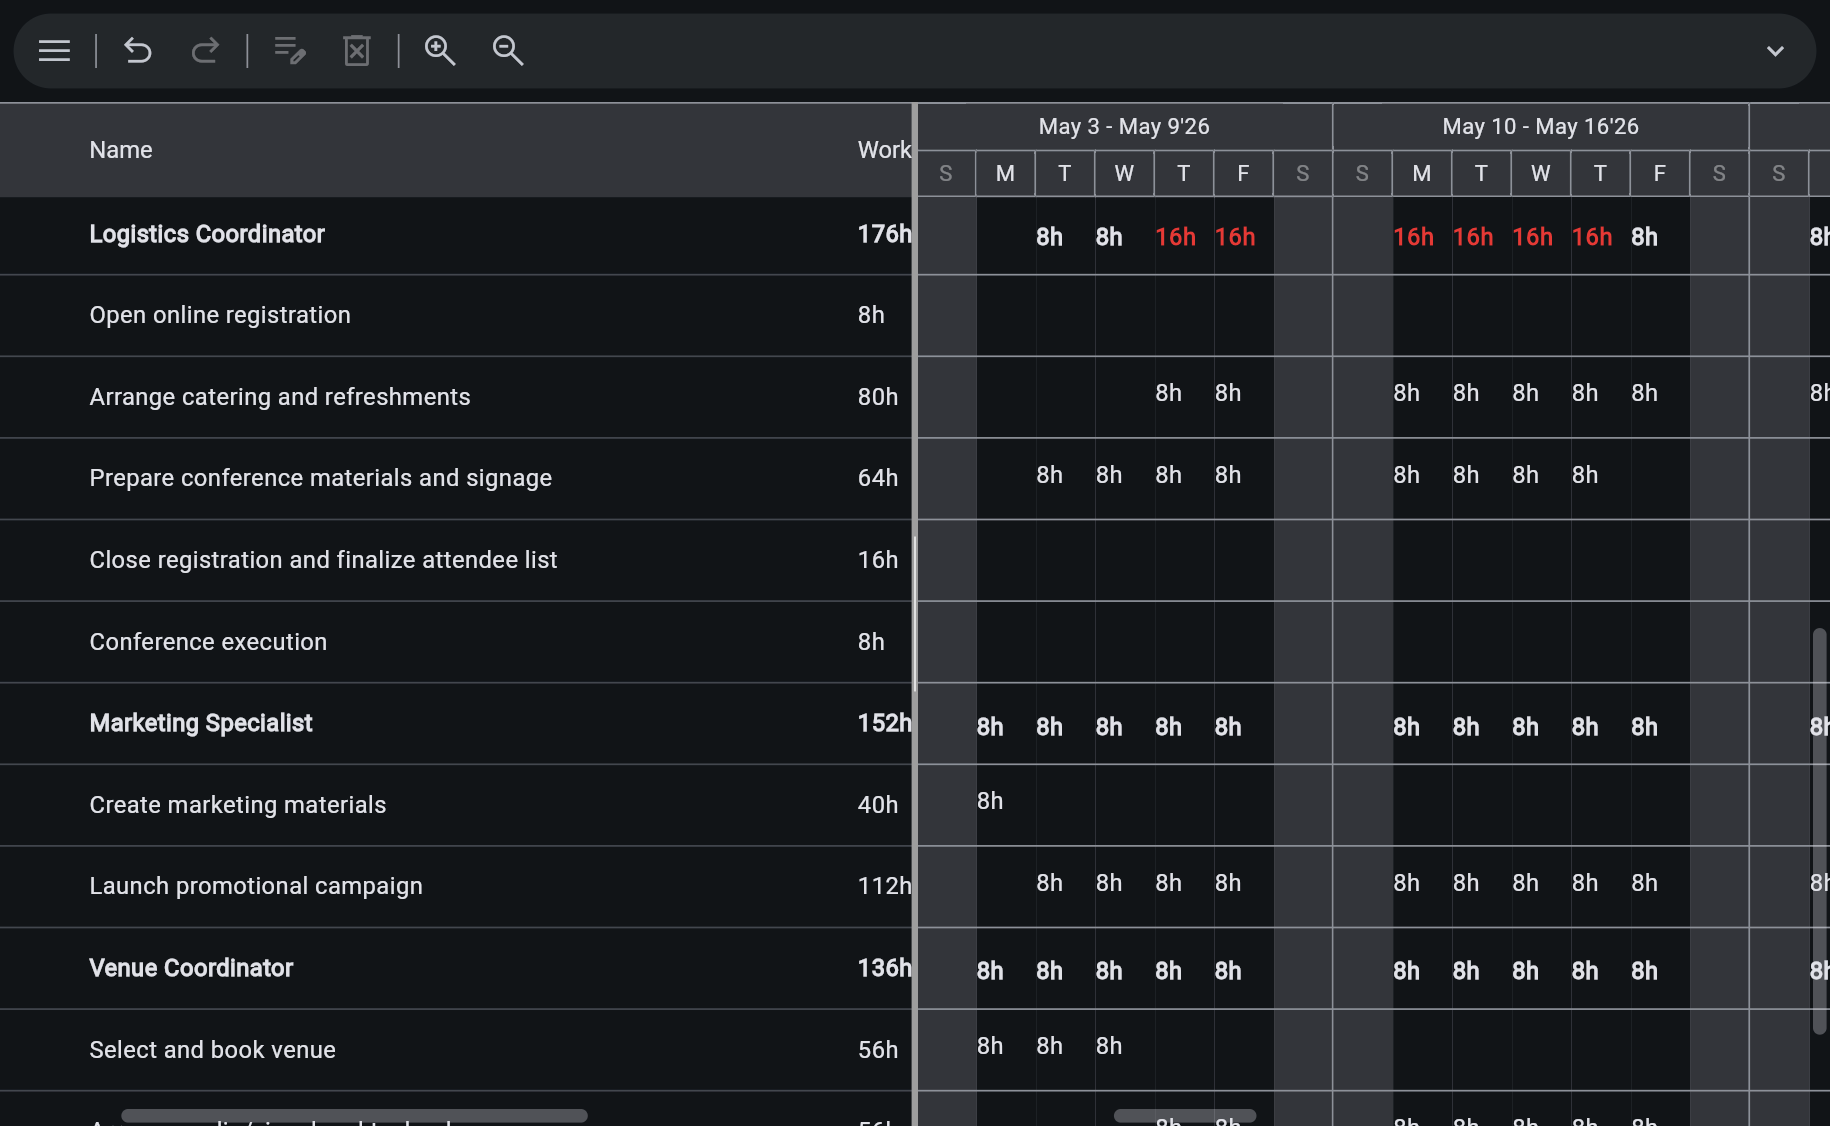
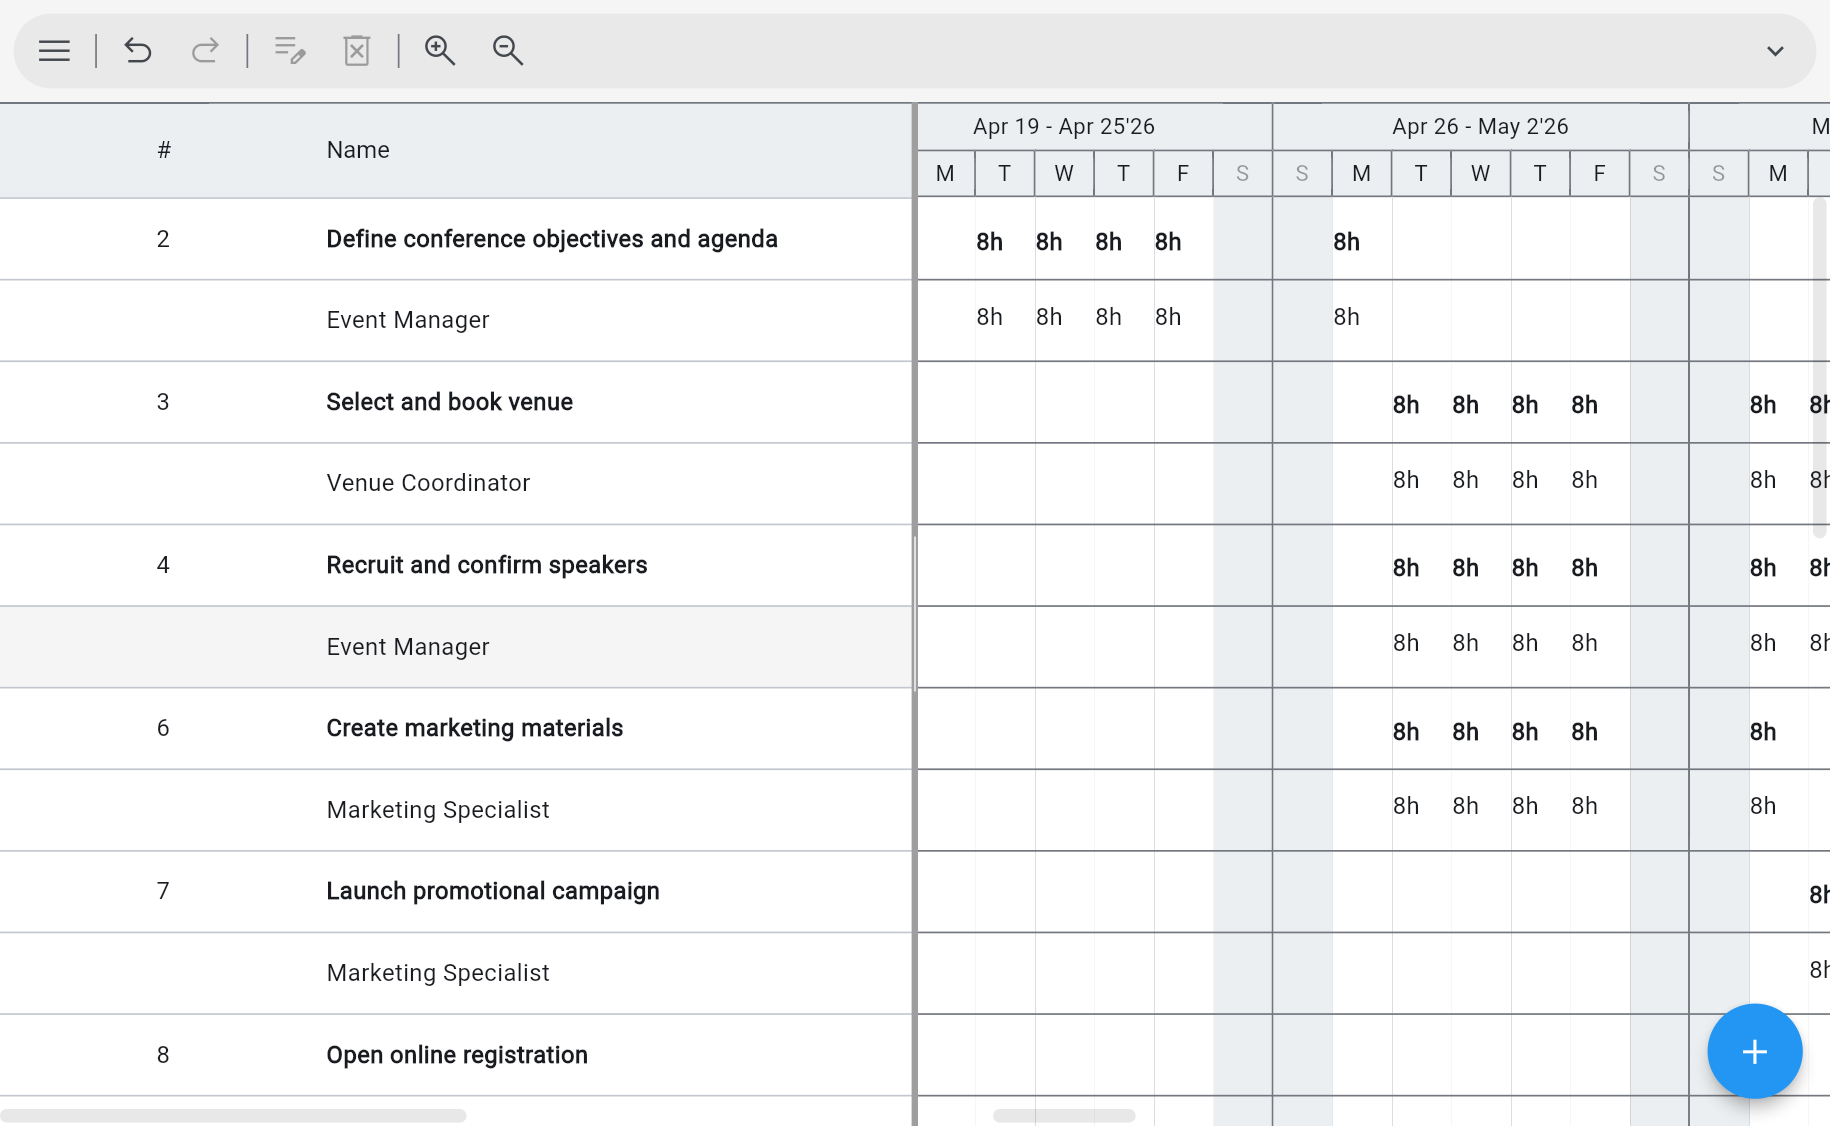
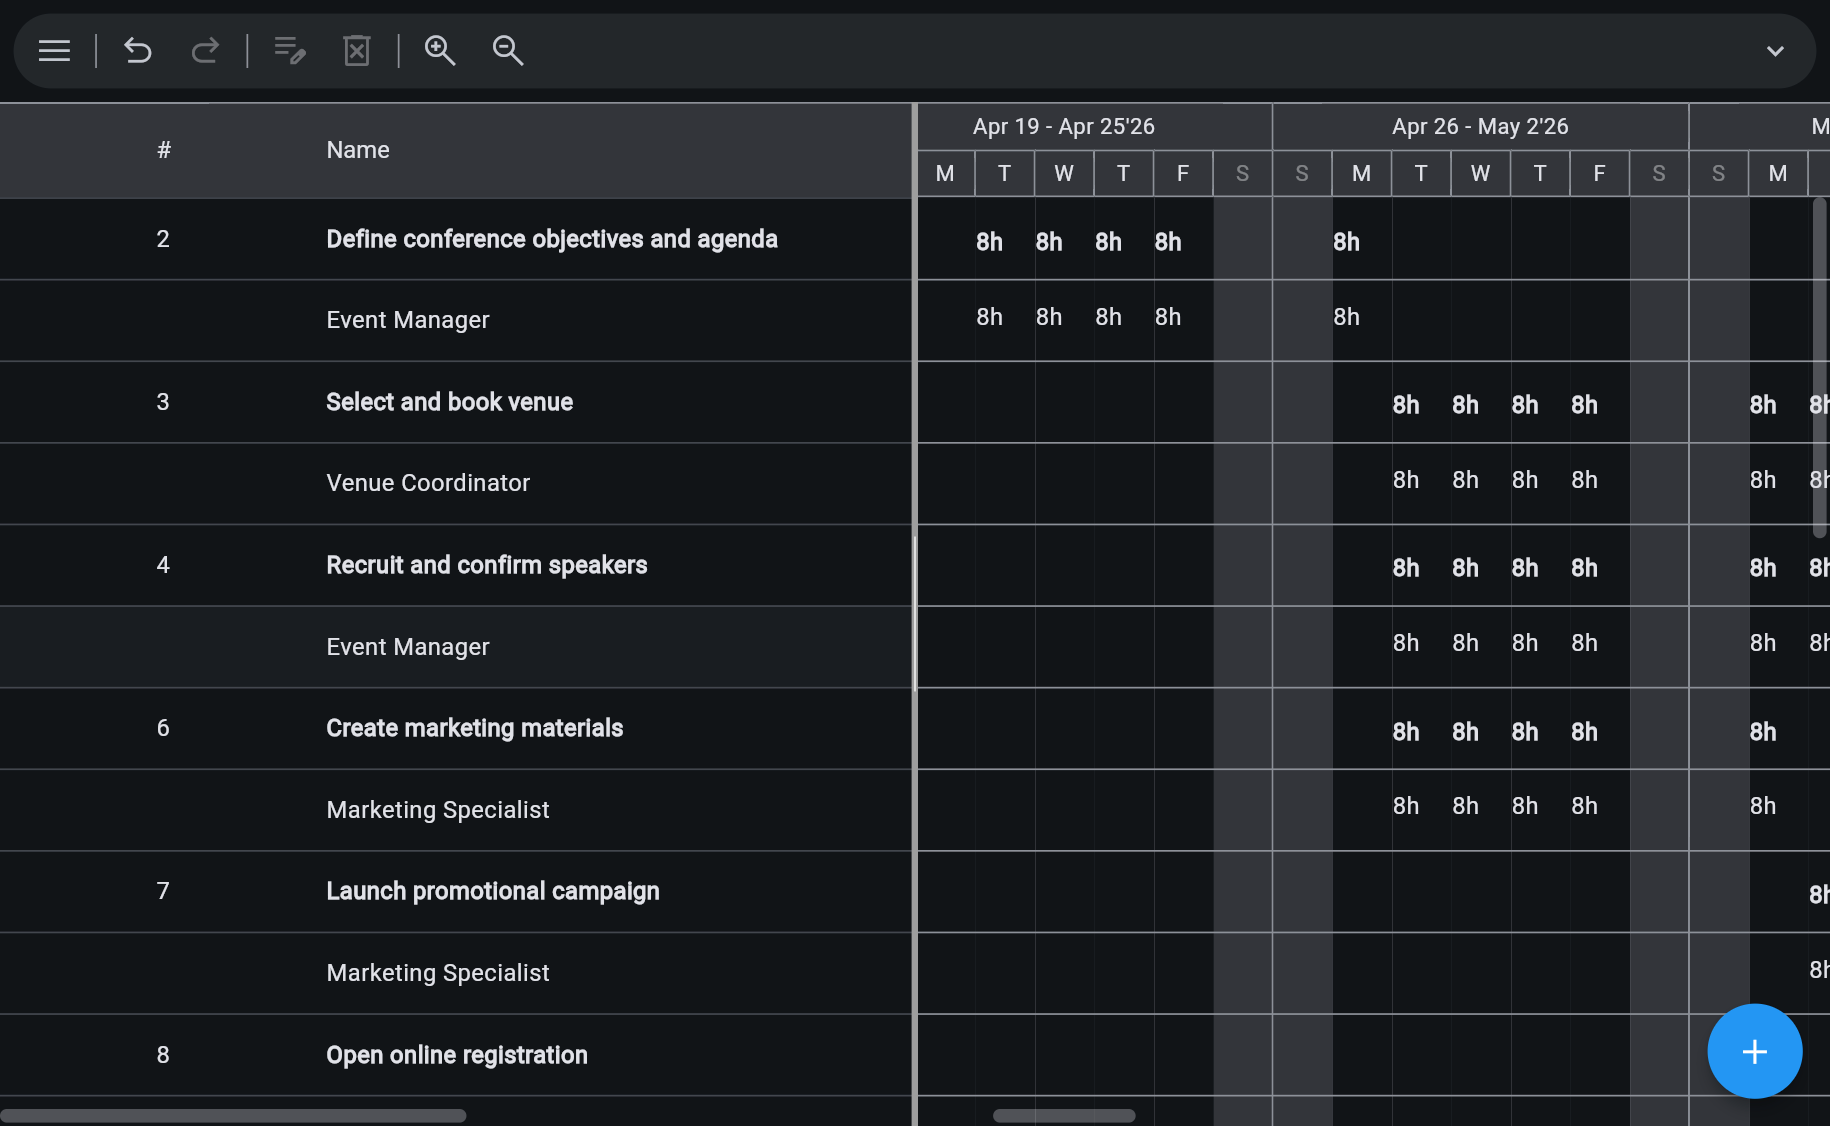
- Critical Path Method computes the finish date from dependencies and durations — not guesswork.
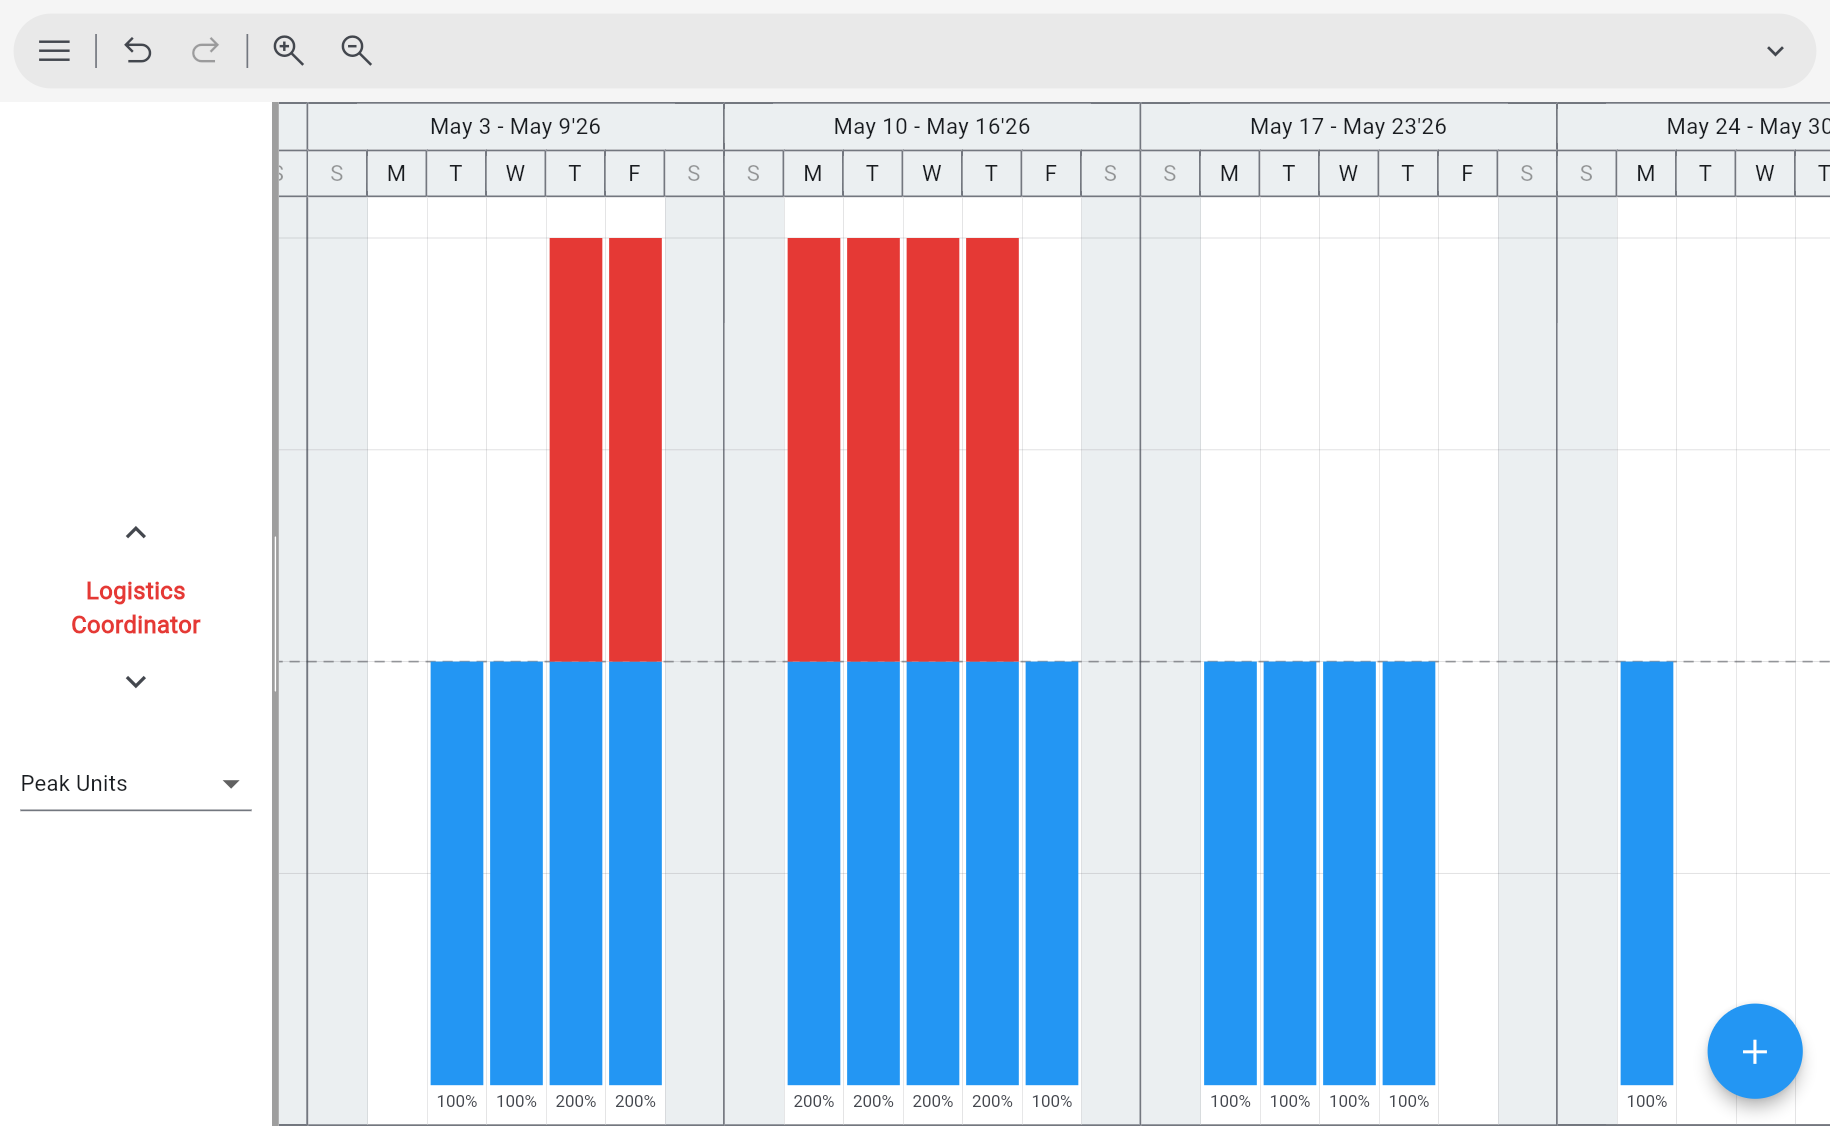
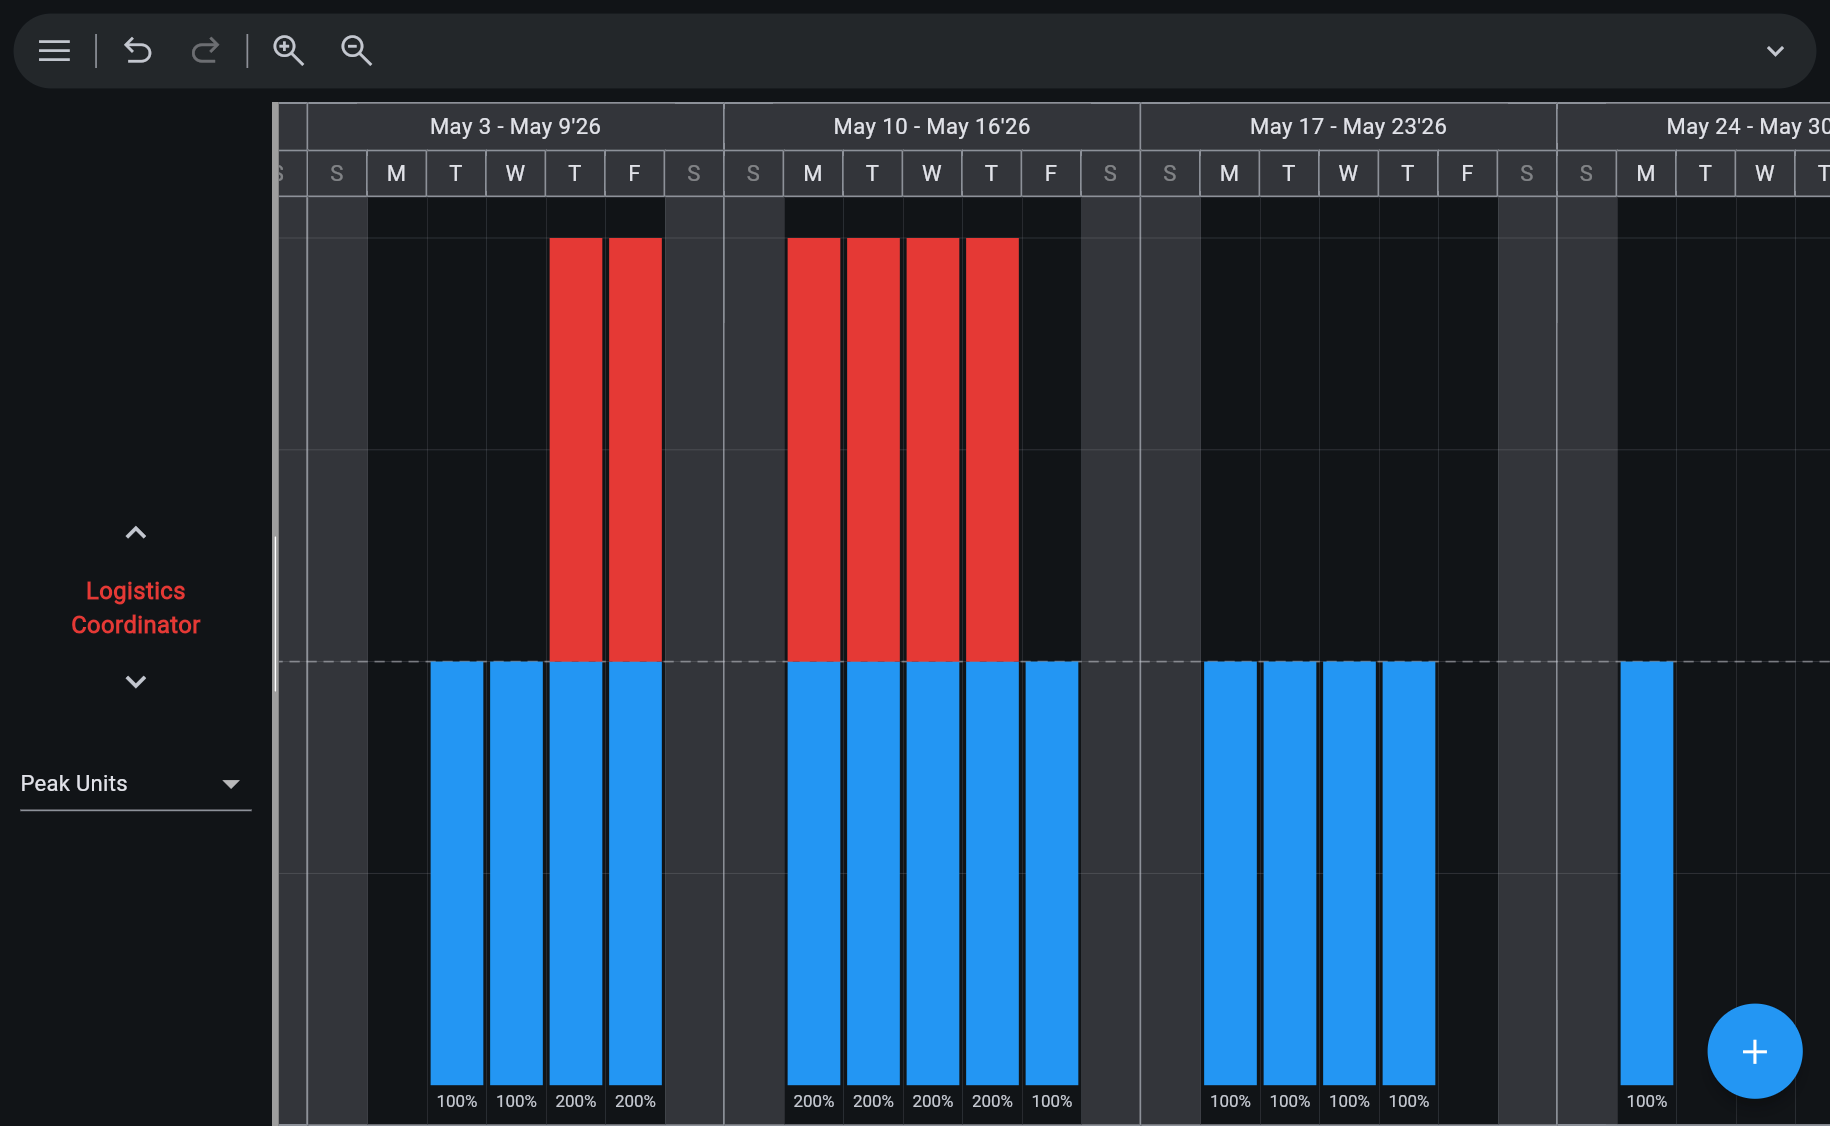
- 4 dependency types, 8 constraint types, split & recurring tasks, 9 work-contour types.
- Custom calendars, work weeks, and elapsed durations.
- Change one thing — the entire schedule recalculates instantly.